Using Scripts to build Reports
Example 1
- On the Reports :: My Reports page, click Create new report.
-
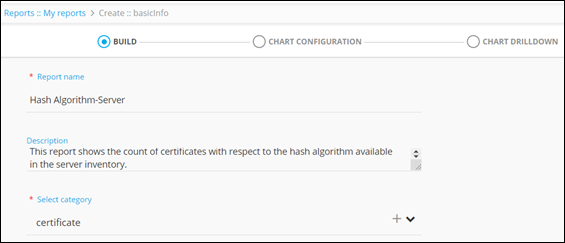
Under the BUILD section, enter or select the field
information.
 This table describes the field information under this section:
Field Description *Report name Enter a valid report name. For example, Hash Algorithm-Server.
Description Enter a description of the report. For example: This report shows the count of certificates with respect to the hash algorithm available in the server inventory.
*Select category Select category as certificate. * : Mandatory fields - Select the ACL restricted check box.
-
Select a sample script from the list of available hooks.
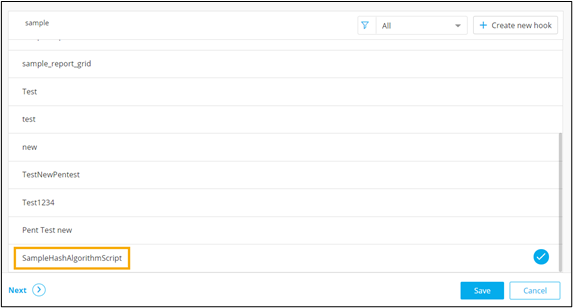
- To save your selections, click Next.
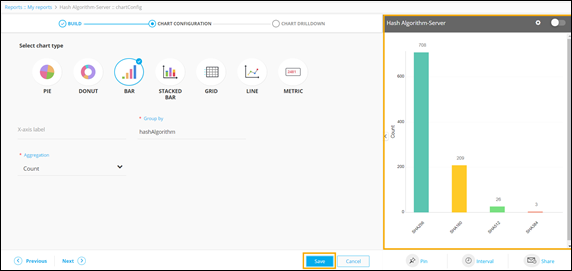
- Under the CHART CONFIGURATION section, select the BAR chart.
-
Enter or select the required field information.
 This table describes the field information under this section:
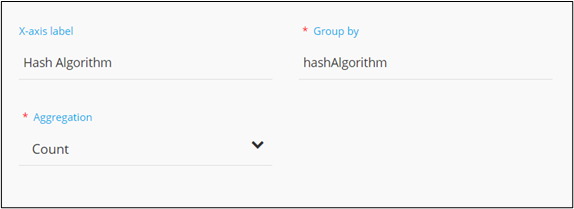
Field Description X-axis label Enter the criteria for the X-axis label. For example, Hash algorithm.
*Group by Select a value from the dropdown menu on the basis of which report data will be grouped. For example, hashAlgorithm.
*Aggregation Select the calculation to be done on the report data for the dropdown. The following options are available: - Average: Calculates the average value of a given set of data.
- Sum: Calculates the sum of all values in a given set of data.
- Count: Calculates the total number of items in a given numeric field.
- Maximum: Displays the maximum value in a given set of data.
- Minimum: Displays the minimum value in a given set of data.
* : Mandatory fields -
Click Save.
A preview of the bar chart is displayed on the right side of the screen.
- To add drill down to the report, click Next.
-
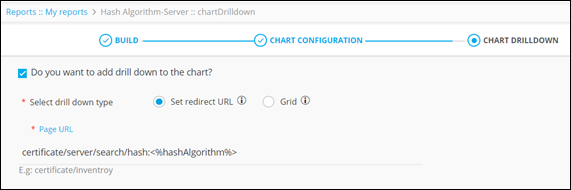
Under the CHART DRILLDOWN section, enter or select
the required field information.
 The following table describes the field information on this page:
Field Description *Select drill down type Select drill down type as redirect URL. *Page URL Enter a valid URL. * : Mandatory fields -
To enable drill down, click Save & Enable.
You will be redirected to the drill down URL, click on any of the bars on the bar chart.
Example 2
- On the Reports :: My Reports page, click Create new report.
-
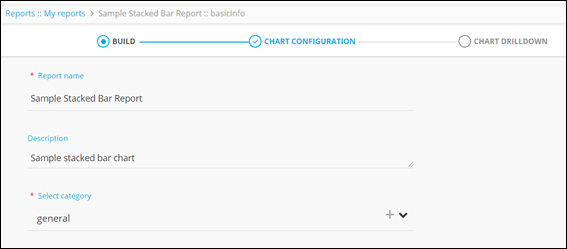
Under the BUILD section, enter or select the
required field information.
 This table describes the field information in this section:
Field Description *Report name Enter a valid report name. Description Enter a valid description of the report. *Select category Select category as general. * : Mandatory fields -
Select the required hook from the list and click
 .
.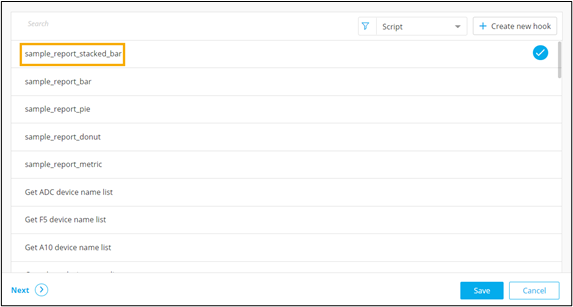
- Click Next.
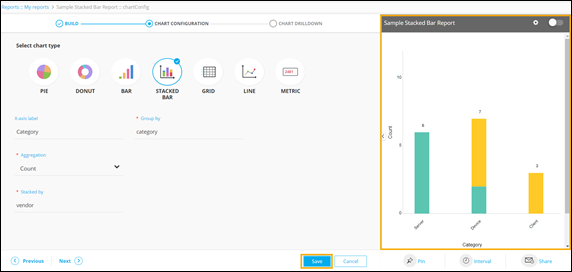
- Under the CHART CONFIGURATION section, select the STACKED BAR chart.
-
Enter or select the field information on this page.
 This table describes the fields in this section:
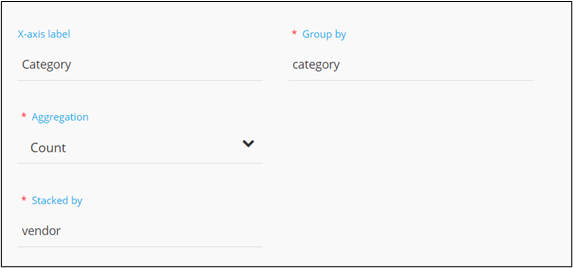
Field Description X-axis label Enter the criteria for the X-axis label. *Group by Enter the criteria on the basis of which report data will be grouped. For example, category.
*Aggregation Select the calculation to be done on the report data for the dropdown. The following options are available: - Average: Calculates the average value of a given set of data.
- Sum: Calculates the sum of all values in a given set of data.
- Count: Calculates the total number of items in a given numeric field.
- Maximum: Displays the maximum value in a given set of data.
- Minimum: Displays the minimum value in a given set of data.
*Stacked by Enter the criteria on the basis of which report data will be stacked. For example, vendor.
* : Mandatory fields -
Click Save.
A preview of the stacked bar chart is displayed on the right side of the screen.