BYOR with Actionable Workflow
To assign an actionable workflow to your report:
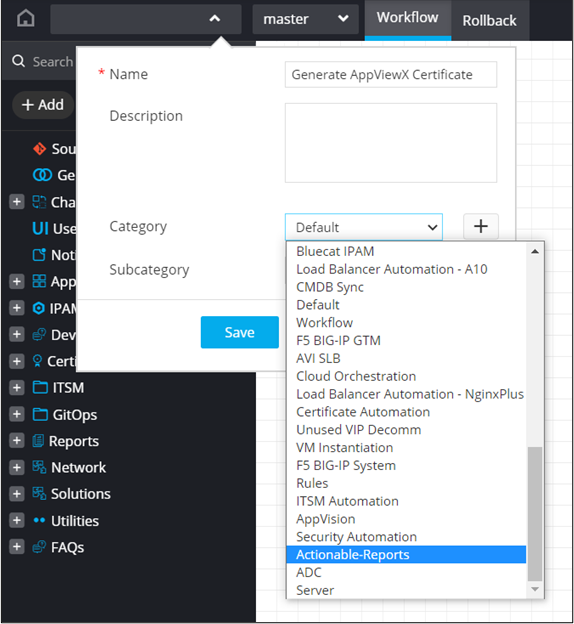
- Go to the Workflow page in the Automation module.
- To create a new workflow, click Create New.
-
Enter or select the field information.
 The following table describes the various fields in this section:
Field Description *Name Enter a valid name for the workflow. For example: Generate AppViewX Certificate. Description Enter a description for the workflow. Category Select the category as Actionable-Reports from the dropdown list. Subcategory The subcategory is set to default. * : Mandatory fields - Drag and drop the relevant workflow tasks and enable the workflow.
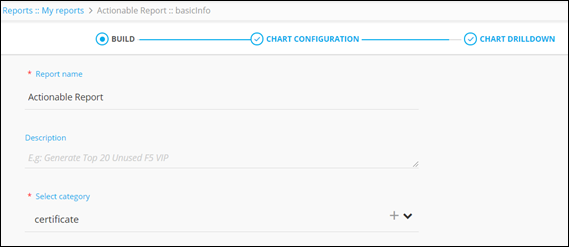
- Go to the Reports :: My Reports page and click Create new report.
-
Under the BUILD section, enter or select the field information.
 The following table describes the fields under this section:
Field Description *Report name Enter a valid report name. For example: Actionable Report. Description Enter a description of the report. *Select category Select the category as certificate from the dropdown. * : Mandatory fields -
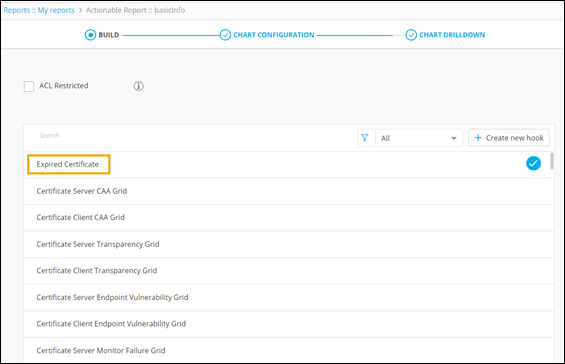
Select the hook from the list and click Next.
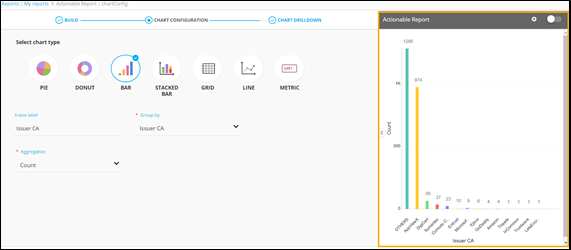
- Under the CHART CONFIGURATION section, select the chart type as BAR.
-
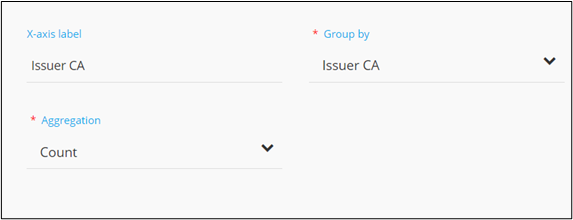
Select the field information for creating the chart.
 This table describes the field information in this section:
Field Description X-axis label Enter the criteria for the X-axis label. For example: Issuer CA. *Group by Select a value from the dropdown list on the basis of which report data will be grouped. For example: Issuer CA. *Aggregation Select the calculation to be done on the report data for the dropdown. The following options are available: - Average: Calculates the average value of a given set of data.
- Sum: Calculates the sum of all values in a given set of data.
- Count: Calculates the total number of items in a given numeric field.
- Maximum: Displays the maximum value in a given set of data.
- Minimum: Displays the minimum value in a given set of data.
* : Mandatory fields -
Click Save.
A preview of the chart is generated on the right side of the screen.
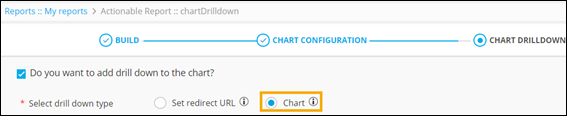
- To add Chart Drilldown, click Next.
-
Select drilldown type as Chart.
-
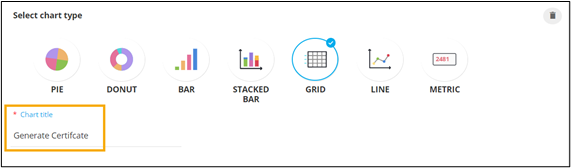
Select the chart type as GRID and enter the Chart title as
Generate Certificate.
-
To configure the column headers to be displayed within the grid, click
 .
Selected columns are displayed on the right.
.
Selected columns are displayed on the right.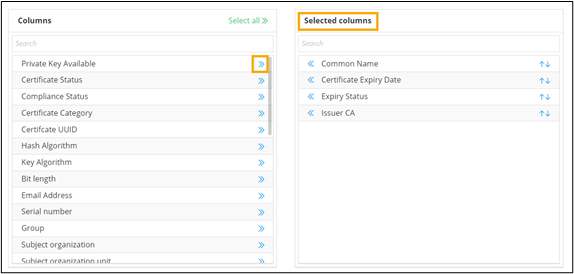
-
Enter or select the field information to associate a workflow with the
report.
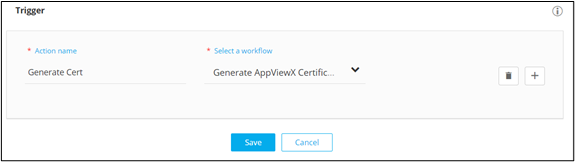 This table describes the field information in this section:
Field Description *Action name Enter a valid action name. For example: Generate Cert. *Select a workflow Select the workflow that was created (Generate AppViewX Certificate) from the dropdown menu. * : Mandatory fields - To enable the workflow, click Save & Enable.
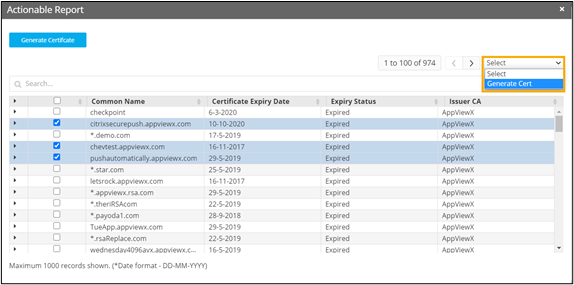
- To display the chart drilldown, click any of the bars in the graph.
- Select the Common Name for the actionable workflow.
-
To trigger the workflow, select the workflow from the dropdown menu.
-
On the Request :: All page, select the
workflow Request ID.
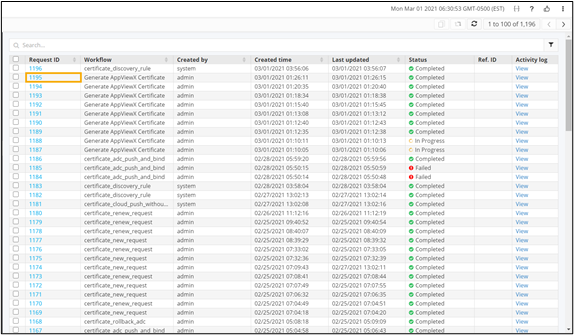 A stage-wise view of the workflow is displayed.
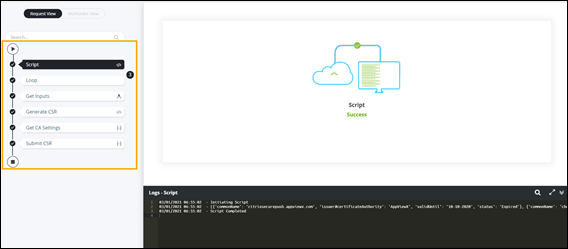
- To view the payload that was passed for the actionable workflow, click Script.
- To see successful completion of the workflow, click Submit CSR.