Using REST API to build Reports
Creating a Report using Sample REST API
- On the Reports :: My Reports page, click Create new report.
-
Under the BUILD section, enter or select the
required field information.
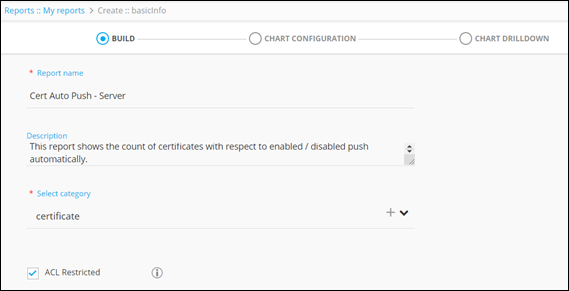 This table describes the field information under this section:
Field Description *Report name Enter a valid report name. For example, Cert Auto Push server.
Description Enter a valid description for the report. For example: This report shows the count of certificates with respect to enabled / disabled push automatically.
*Select category Select category as certificate. ACL restricted Select this checkbox to query certificates based on role permission. * : Mandatory fields -
Select a sample API hook from the list of preexisting hooks.
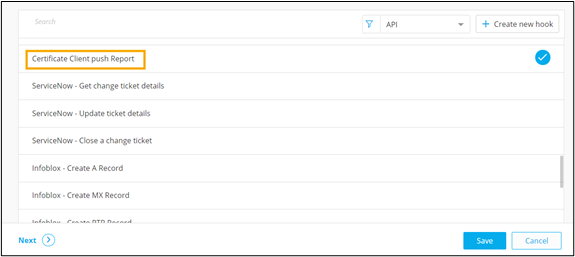
- Click Next.
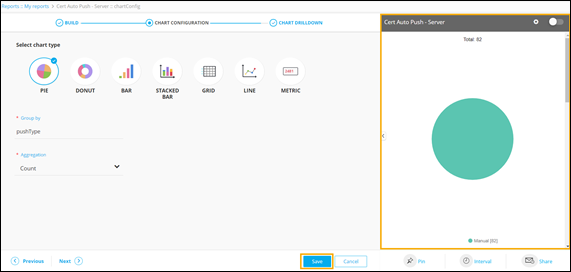
- Under the CHART CONFIGURATION section, select the PIE chart.
-
Enter or select the required field information.
 The following table describes the field information in this section:
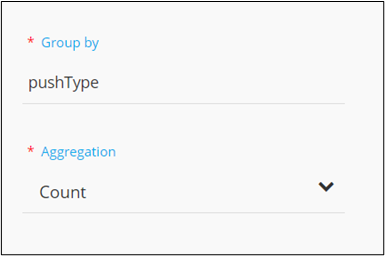
Field Description *Group by Enter the criteria on the basis of which report data will be grouped. For example: pushType.
*Aggregation Select the calculation to be done on the report data for the dropdown. The following options are available: - Average: Calculates the average value of a given set of data.
- Sum: Calculates the sum of all values in a given set of data.
- Count: Calculates the total number of items in a given numeric field.
- Maximum: Displays the maximum value in a given set of data.
- Minimum: Displays the minimum value in a given set of data.
* : Mandatory fields -
Click Save.
A preview of the pie chart is generated on the right side of the screen.