Using Preexisting Hooks to Build Reports
Note: For more information on the Hooks Inventory,
refer to the Automation User Guide.
Example 1
- On the Reports :: My Reports page, click Create new report.
-
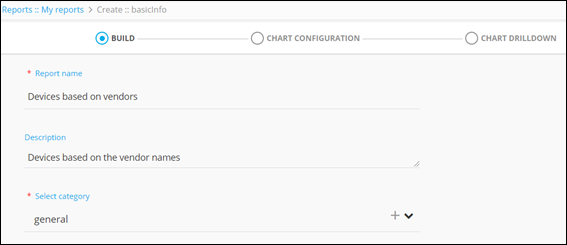
On the Reports :: My reports > Create :: basicinfo page that is
displayed, under the BUILD section, enter or select
the required field information.
 The following table describes the various fields in this section:
Field Description *Report name Enter a valid report name. For example: Devices based on vendors. Description Enter a valid description. For example: Devices based on the vendor names. *Select category Select the category as general from the dropdown list. * : Mandatory fields - Search for the required hook from the pre-existing inventory.
-
To select the hook, click
 .
.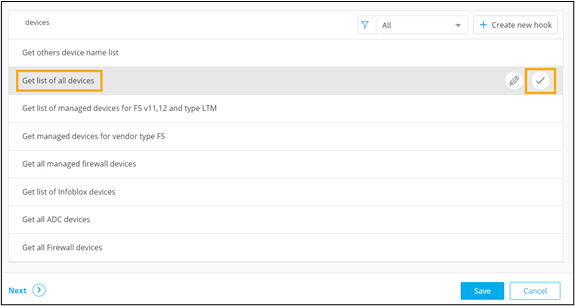
- Click Next.
-
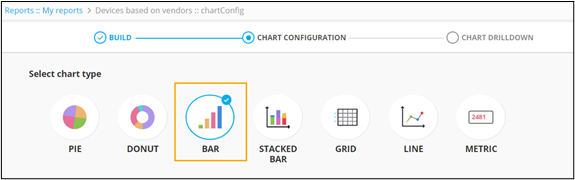
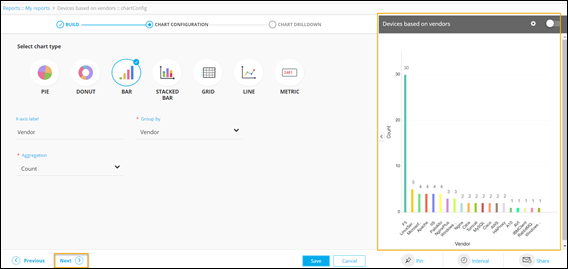
Under the CHART CONFIGURATION section, that is
displayed, select the BAR chart.
-
Enter or select the required field information.
 The following table describes the various fields in this section:
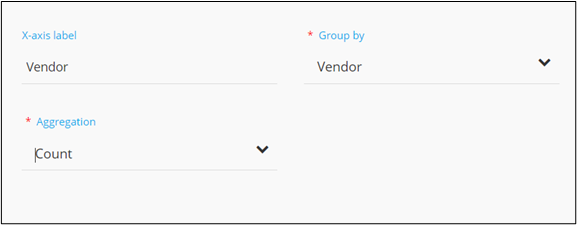
Field Description X-axis label Enter criteria for the X-axis label. For example: Vendor.
*Group by Select a value from the drop down menu on the basis of which report data will be grouped. For example: Vendor.
*Aggregation Select the calculation to be done on the report data for the dropdown. For example, count to get the number of devices by name. The following options are available:- Average: Calculates the average value of a given set of data.
- Sum: Calculates the sum of all values in a given set of data.
- Count: Calculates the total number of items in a given numeric field.
- Maximum: Displays the maximum value in a given set of data.
- Minimum: Displays the minimum value in a given set of data.
* : Mandatory fields -
To save chart configuration, click Next.
A preview of the bar chart is displayed on the right side of the screen.
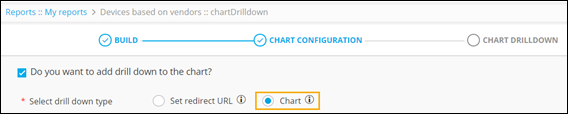
- To add a drill down to the chart, under the CHART DRILLDOWN section that is displayed, select the Do you want to add drill down to the chart? check box.
-
Select the type of drill down as Chart.
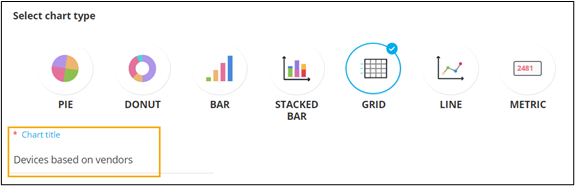
-
Select chart type as GRID and enter the Chart
title.
-
To configure the column headers to be displayed within the grid, click
 .
Selected columns are displayed on the right side.
.
Selected columns are displayed on the right side.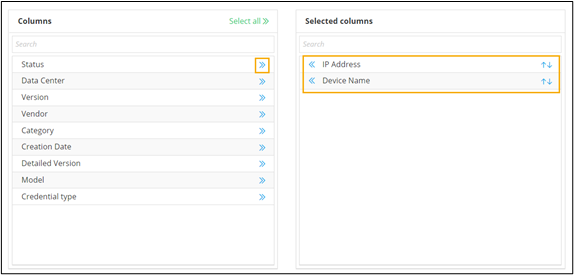
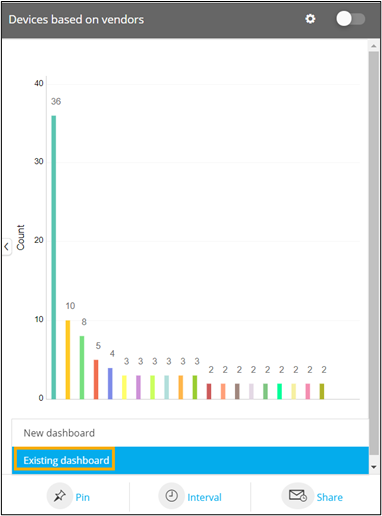
- To pin the report to a dashboard, under the chart preview, click Pin.
-
To pin the report to a dashboard already available in the Dashboard
inventory, select Existing dashboard from the
options.
- Select a dashboard from the list and click Save.
- To enable the report, click Save & Enable.
-
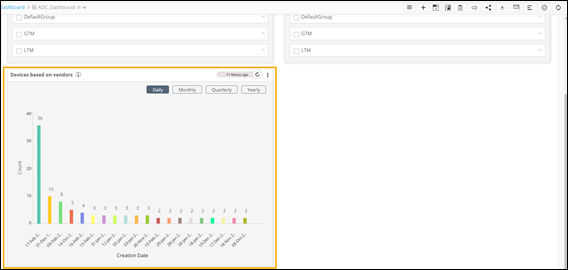
To view this report on the dashboard, select this dashboard on the
Dashboard inventory page.
The Devices based on vendors report can be seen on the selected dashboard.
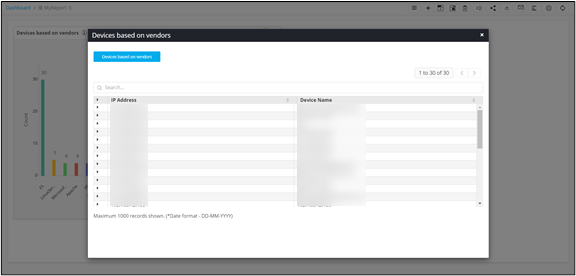
-
To display specific data on each of the vendors, click on any of the bars
for the chart drilldown.
Example 2
- On the Reports :: My Reports page, click Create new report.
-
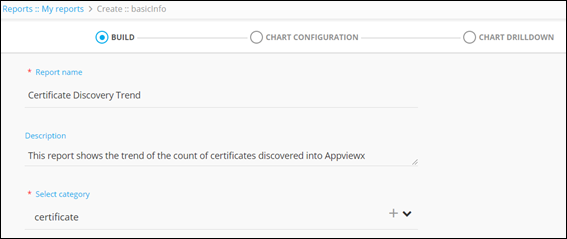
On the Reports :: My reports > Create :: basicinfo page that is
displayed, under the BUILD section, enter or select
the required field information.
 The following table describes the various fields in this section:
Field Description *Report name Enter a valid report name. For example: Certificate Discovery Trend.
Description Enter a valid description. For example: This report shows the trend of the count of certificates discovered into AppViewX.
*Select category Select the category as certificate from the dropdown list. * : Mandatory fields - Search for the required hook from the pre-existing inventory.
-
To select the hook, click .
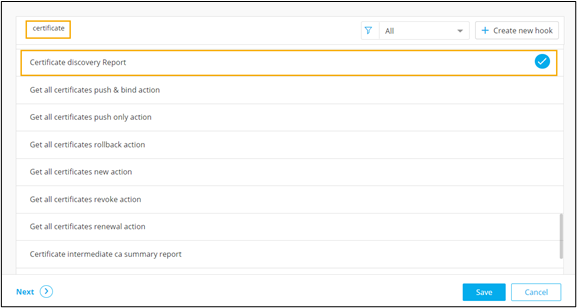
- Click Next.
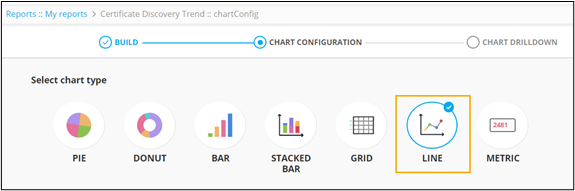
-
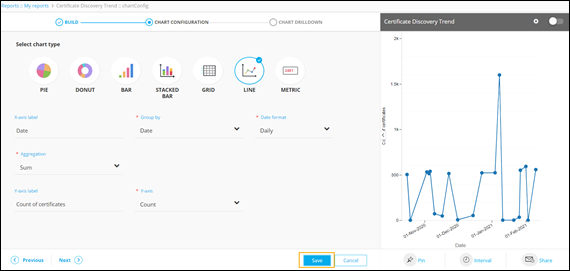
Under the CHART CONFIGURATION section that is
displayed, select the LINE chart.
-
Enter or select the required field information.
 The following table describes the various fields in this section:
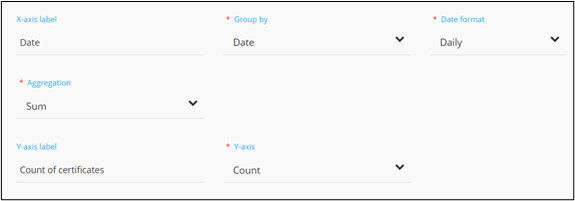
Field Description X-axis label Enter the criteria for the X-axis label. For example: Date.
*Group by Enter the value on which data will be grouped. For example: Date.
*Date format Select a valid date format from the dropdown. For example: Daily.
*Aggregation Select the calculation to be done on the report data for the dropdown. For example, count to get the number of devices by name. The following options are available:- Average: Calculates the average value of a given set of data.
- Sum: Calculates the sum of all values in a given set of data.
- Count: Calculates the total number of items in a given numeric field.
- Maximum: Displays the maximum value in a given set of data.
- Minimum: Displays the minimum value in a given set of data.
Y-axis label Enter the criteria for the Y-axis label. For example: Count of certificates.
*Y-axis Select a value from the dropdown. For example: Count.
* : Mandatory fields -
To save chart configuration details, click
Save.
A preview of the line chart is displayed on the right side of the screen.