Designing a Custom Grid Chart
- The grid chart supports server side search functionality.
- It also supports server side sorting, where you can sort the report data in ascending or descending order.
- Grid chart also has provision for downloading high volumes of data in Excel or CSV formats.
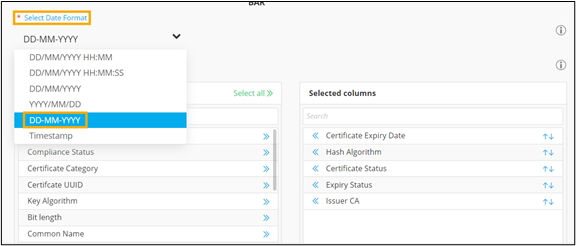
- Date formats are customizable for grid charts as per user needs. You can select the specific date format from the dropdown.
To design a custom grid chart:
- Build a report.
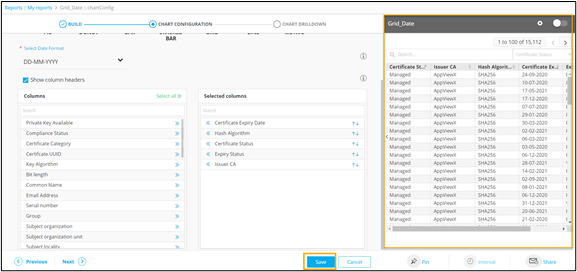
- Under the CHART CONFIGURATION section, select the GRID chart.
-
Select Date Format from the dropdown.
-
To configure the column headers to be displayed within the grid, click
 .
Tip: To arrange the order in which Selected columns are displayed in the grid, click
.
Tip: To arrange the order in which Selected columns are displayed in the grid, click .
. -
Click Save.
A preview of the grid chart is generated on the right side of the screen.
-
To select the data loading pattern, click
 (Settings) icon.
The following options are displayed:
(Settings) icon.
The following options are displayed:- Instant: This option allows you to enable live data loading and see changes in data immediately. This can be used in the case of small databases.
- Deferred: This option allows you to enable lazy data loading and is useful in the case of larger databases. The default time interval for this is set at 30 minutes.
-
In the Format Grid section, update the colours for Grid Head and Grid
Row as follows:
For Grid Head:
- *Select Grid head font colour - Click the colour box below to display the colour palette and choose the desired color for the font.
- *Select Grid head background colour - Click the colour box below to display the colour palette and choose the desired color for the background.
- *Select Grid head font size - Choose between Small, Medium, and Large.
For Grid Row:- *Select Grid row font colour - Click the colour box below to display the colour palette and choose the desired color for the font.
- *Select Grid row background colour - Click the colour box below to display the colour palette and choose the desired color for the background.
- *Select Grid row font size - Choose between Small, Medium, and Large.
-
To enable the report, turn on the toggle. Only enabled reports are visible on
the dashboard to which they are pinned.
Note: Color code mapping is not applicable to the grid chart.
-
Click Next.
The CHART DRILLDOWN section is displayed.