Chart Drilldown
How to Set a Redirect URL
To add a redirect URL to your report:
- Build a report.
- Design a custom chart.
-
Under the CHART DRILLDOWN section, enter
or select the required field information.
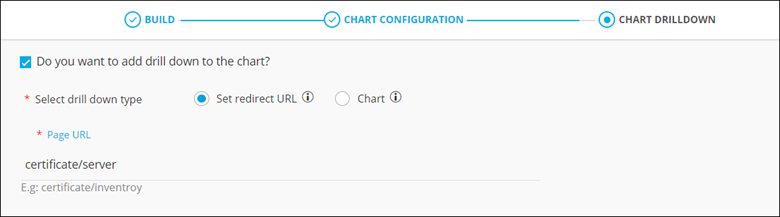 The following table describes the field information required in this section:
Field Description Do you want to add a drill down to the chart? To add a drilldown to the chart, select this checkbox. *Select drill down type Select Set redirect URL. *Page URL Enter a valid URL. * : Mandatory fields - Click Save & Enable.
How to Add a Drilldown Chart
You can add up to five levels of drilldown charts to a report.
-
Under the CHART DRILLDOWN section, enter
or select the required field information.
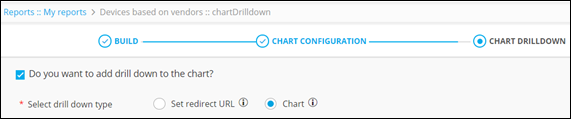 The following table describes the field information required in this section:
Field Description Do you want to add a drill down to the chart? Check this box to add a drilldown to the chart. *Select drill down type Select Chart as the drilldown type. * : Mandatory fields -
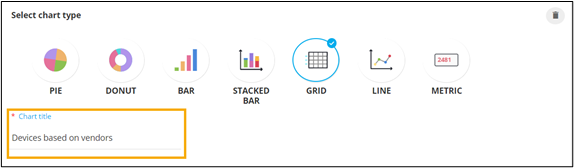
Select the GRID chart. and enter a suitable
Chart title.
-
To configure the column headers to be displayed within the grid, click
 .
Selected columns are displayed on the right side.
.
Selected columns are displayed on the right side.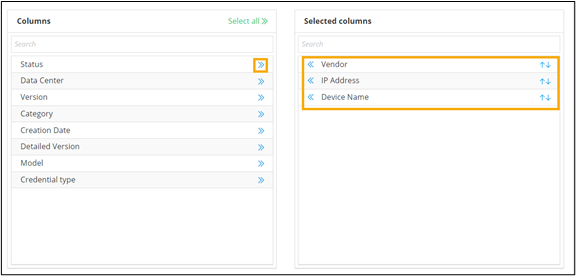 Note: To remove a column, click
 .
. - To enable the chart, click Save & Enable.
- To get more information on the devices in the drilldown, click on any of the bars on the bar chart.