
Managed Agent Details

| Tab | What it helps you understand |
|---|---|
| Agent Posture | Security and posture issues affecting the agent. |
| Connections | MCP servers and other connections associated with the agent. |
| Credentials | Credentials associated with the agent's connections. |
| Users | Users associated with the agent. |
| Access Graph | How users, credentials, MCP servers, connections, and tools relate to the agent, including historical changes. |
| Event Logs | Historical activity and security events associated with the agent. |
| Usage | Token consumption, cost trends, and detailed usage records for the agent. |
| Item | What it tells you |
|---|---|
| Agent name and platform | Identifies the selected managed agent and the platform on which it operates. |
| Owner | Shows the user associated with the agent. |
| Risk level | Shows the agent's current overall risk level: Low, Medium, High, or Critical. |
| Status | Shows whether the agent is currently Active or Deactivated. |
| Refresh | Refreshes the agent details shown on the page. |
| Activate / Deactivate | Controls whether the agent can continue to be used. |

Agent Risk
Understand Risk Breakdown
For example, an agent can have Low User Risk and Low Identity Risk, while Access Risk is High because of Tool Sprawl and Posture Risk is Critical because of unresolved posture findings or unsanctioned resources. The overall agent risk is calculated from the applicable categories using the organization's configured risk model.
| Risk area | Where to investigate |
|---|---|
| Posture Risk | Agent Posture |
| Access Risk | Access Graph and Connections |
| Identity Risk | Credentials |
| User Risk | Users |
Agent Posture
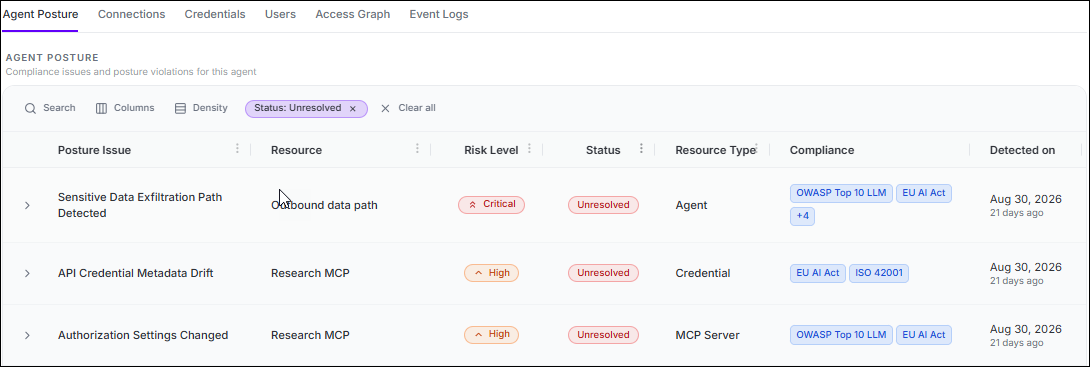
| Field | Description |
|---|---|
| Posture Issue | The security or configuration issue identified for the agent. |
| Resource | The resource associated with the finding. |
| Risk Level | The severity assigned to the finding. |
| Status | Whether the finding is currently resolved or unresolved. |
| Resource Type | The type of resource associated with the finding, such as Agent, Credential, or MCP Server. |
| Compliance | Compliance frameworks associated with the posture issue. |
| Detected On | When the posture issue was detected. |
Connections
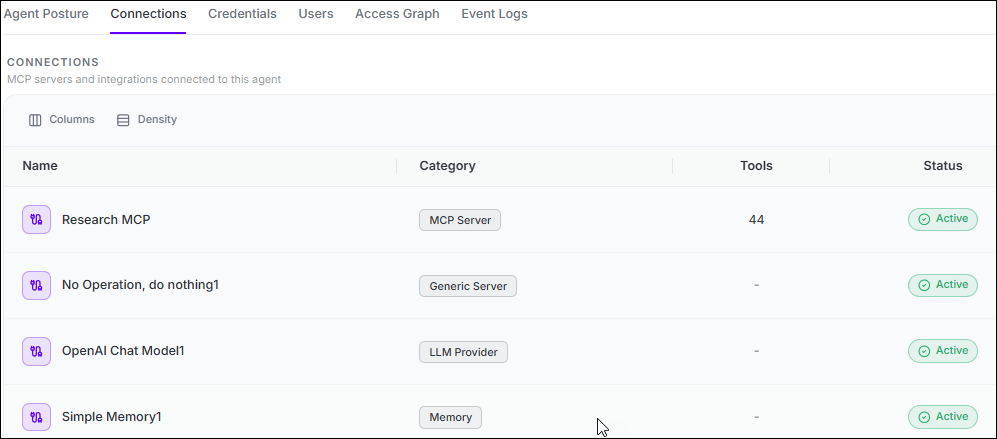
| Field | Description |
|---|---|
| Name | Name of the connected MCP server or integration. |
| Category | Connection category, such as MCP Server. |
| Tools | Number of tools exposed through the connection. |
| Status | Current status of the connection. |
Credentials
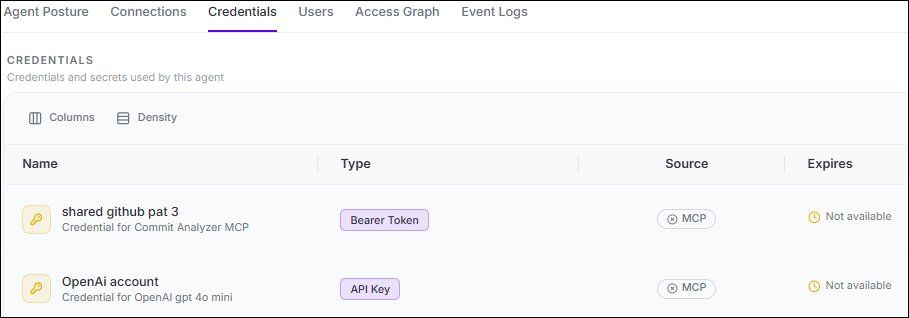
| Field | Description |
|---|---|
| Name | Name or representation of the credential. |
| Type | Authentication type, such as OAuth 2.0. |
| Source | The connection or resource from which the credential originates. |
| Expires | Credential expiration information when available. |
Users
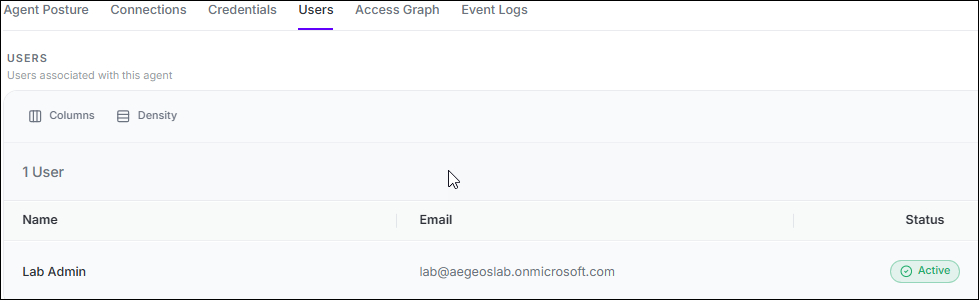 For each associated user, the page shows the user name, email
address, and current status.
For each associated user, the page shows the user name, email
address, and current status.Access Graph
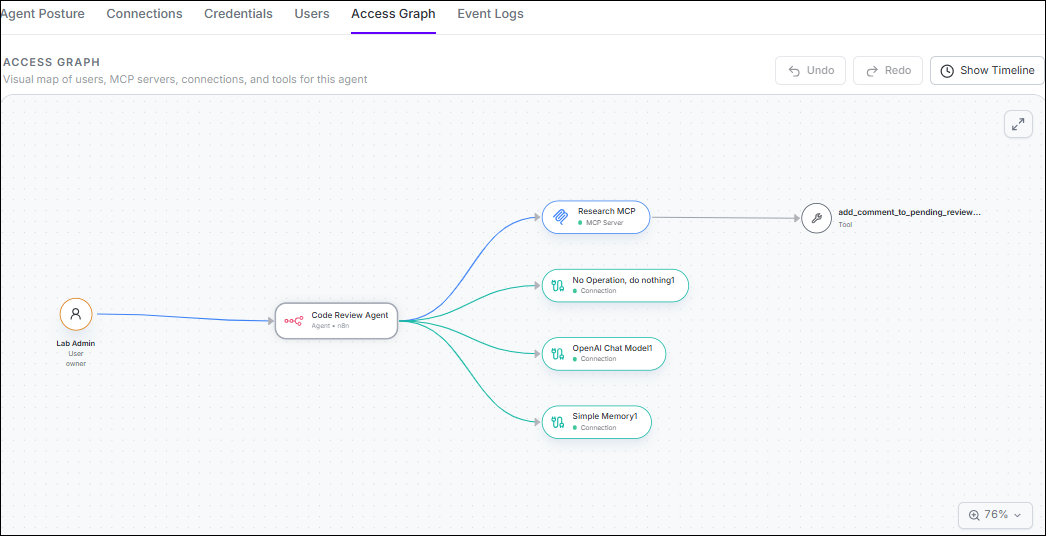
| Resource | What it represents |
|---|---|
| Users | Users associated with the agent. |
| Credentials | Credentials associated with the agent's connections. |
| MCP Servers | MCP servers connected to the agent. |
| Tools | Tools exposed through connected MCP servers. |
| Connections | Other connections associated with the agent. |
| Sub-agents | Child agents spawned by the agent, when present. |
When a group contains many related resources, the graph can collapse additional items into a +N more node to keep the view readable. The Users, Credentials, and Connections tabs provide the corresponding full lists.
- Who is associated with this agent?
- Which MCP servers and other connections are associated with the agent?
- Which credentials are involved in those connections?
- Which tools are available through connected MCP servers?
- Did the agent's access change before or during a security event?
Select Show Timeline to add historical context to the Access Graph. The Timeline records snapshots when the agent's access relationships change. Selecting an entry reconstructs the graph for that point in time, allowing investigators to review a previous access state and identify what changed.
Changes represented in the Timeline can include MCP servers or tools being added or removed, credential or connection changes, users being associated or removed, and changes involving sub-agents when present.
Investigate changes over 24 hours, 7 days, 30 days, 90 days, or a Custom period. For Custom, select the required start and end dates. Use a focused range when investigating activity around a known security event or unexpected access change.
Select Play to reconstruct the Access Graph across the selected period from older snapshots to newer states. As playback progresses, the graph updates to show how relationships were added or removed. Pause playback to examine a particular state, or select an individual Timeline entry to jump directly to that snapshot.
| Use case | How it helps |
|---|---|
| Access-drift analysis | See how the agent's connections and reachable resources changed from an earlier state. |
| Incident investigation | Reconstruct the agent's access relationships around the time of a security event. |
| Change investigation | Determine when a user, credential, MCP server, connection, or tool became associated with or was removed from the agent. |
| Historical analysis | Review a previous access state instead of relying only on the agent's current relationships. |
Event Logs
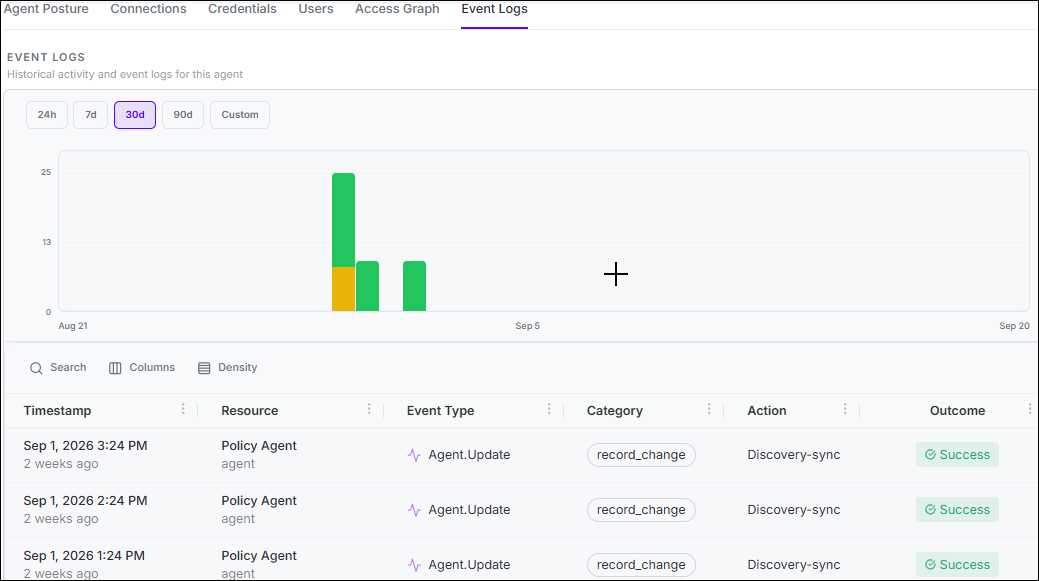
Choose 24h, 7d, 30d, 90d, or Custom. Each bar represents event volume for a time slice, with the bar segmented by risk level. High and Critical events are also marked above the chart so significant activity remains visible even when the total event volume is low.
| Indicator | Meaning |
|---|---|
| Red | Critical events |
| Orange | High-risk events |
| Yellow / Gold | Medium-risk events |
| Green | Low-risk events |
| Red or orange marker | An individual Critical or High-risk event |
Up to 10 of the most recent High or Critical events in the selected range can appear as markers. Hover over a marker to view the event message, or select it to locate the corresponding event in the table.
Click and drag across the chart to select a time window. The Event Logs table is filtered to that period, allowing an investigator to move directly from an activity spike or high-risk marker to the underlying event records. Clear the selected range to return to the full period.
| Field | Description |
|---|---|
| Timestamp | When the event occurred. |
| Resource | The resource associated with the event. |
| Event Type | The type of activity or change recorded. |
| Category | The event classification. |
| Action | The action associated with the event. |
| Outcome | The result of the action, such as Success. |
Use Search, Columns, and Density to refine how the event records are displayed.
Usage
Token Usage shows token consumption over time. Select 7 days, 30 days, 3 months, or 6 months to change the period. The percentage indicator below the chart shows the change in token consumption for the displayed period.
Token Cost shows the cost associated with the agent's token consumption over time in USD. It uses the same time-range options, with a percentage indicator showing the change in cost for the displayed period.
| Field | Description |
|---|---|
| Timestamp | When the token usage was recorded. |
| Tokens | Number of tokens consumed for the recorded activity. |
| Cost (USD) | Cost associated with that token consumption. |
Investigation Workflow
- Start with Agent Risk to understand which risk area is contributing most to the agent's current score.
- Use Agent Posture, Connections, Credentials, or Users to inspect the underlying finding or relationship.
- Use Access Graph and Timeline to reconstruct how access relationships changed over time.
- Use Event Logs to inspect the activity that occurred during the same period.
- Use Usage when token consumption or cost is relevant to the investigation.
