Configuring Server Inventory Settings
Setting the Integration for Log Forwarding
| New Menu | Old Menu |
|---|---|
| In the Platform module, from the navigation pane
on the left, under OBSERVE & EXPLORE, select
Log Forwarding. The Settings :: Log Forwarding page is displayed with the Server inventory tab open by default. |
The Settings :: Log Forwarding page is displayed with the Server inventory tab open by default. |
| For more information on how to switch between menus, click here. | |
-
On the Settings :: Log Forwarding page, in the Server
inventory tab, enter the Server Name and select a Protocol as
described below.
Table 1. Field descriptions for Server inventory Field Description *Server name Name of the external server to which the logs will be forwarded *Protocol Select a protocol from the following options: - UDP (default)
- TCP
- Splunk HEC
- MS Sentinel.
* : Mandatory fields If the Protocol = UDP and Protocol = TCP click here to enter field details.If the Protocol = Splunk HEC click here to enter field details.If the Protocol = MS Sentinel click here to enter field details. - To check the connections with the respecive protocols, click Test Connection.
-
Configure the Log type & severity as follows:
Table 2. Field description for Log type & severity Field Description *Log type & severity You can choose to forward logs of a specific type and a specific severity to an external server. To add a log type and severity entry:- From the first drop-down menu,
select a log type from the following:
- Audit (default)
- Certificate
- ADC
- SSH
- AppViewX
- VisualWorkflow.
- From the second drop-down menu, select the
severity of the log type from the following:
- Notification (default)
- Debug
- Warning
- Error
- Fatal
- Critical.
Note: You can select more than one severity value for a log type.
To add multiple log types and severity entries:To delete a log type and severity entry, from the Log type & severity field, click- From the Log type &
severity field, click
 (Add) icon.
 - From the first drop-down menu, select a log type.
- From the second drop-down menu, select a severity for the log type.
- To add another log type and severity entry, repeat steps a to c.
 (Delete) icon. Note: It is mandatory to have at least one log type and severity entry.
* : Mandatory fields - From the first drop-down menu,
select a log type from the following:
-
To save the server inventory settings, click Save.
The settings configured in the fields above are displayed in the table shown at the end of the page.
UDP and TCP
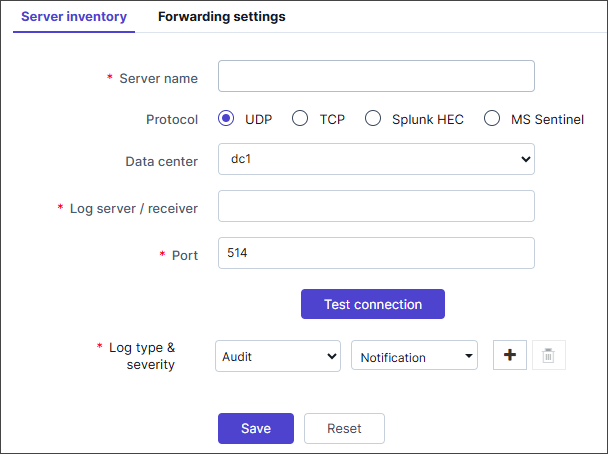
| Field | Description |
|---|---|
| Data center | From the options available in the dropdown, select the data center. |
| *Log server / receiver | The IP address of the external server to which the logs will be forwarded |
| *Port | Enter the port number to be used for the server. |
| * : Mandatory fields | |
Proceed with the integration from step 2 in the section Setting the Integration for Log Forwarding.
Splunk HEC
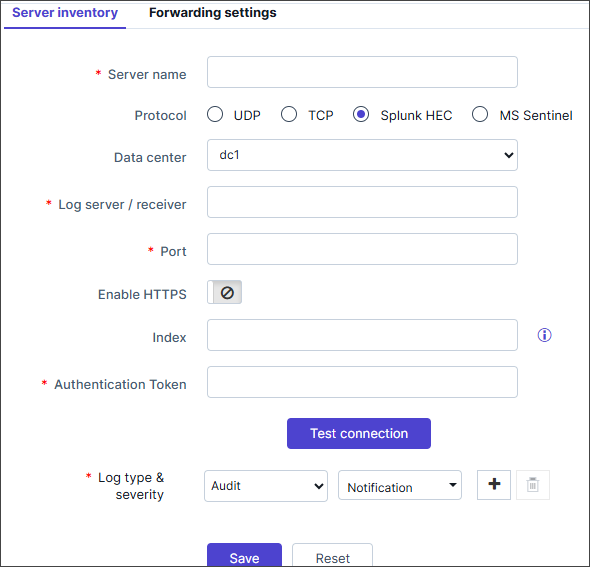
Enter the fields as follows:
| Field | Description |
|---|---|
| Data center | From the options available in the dropdown, select the data center. |
| *Log server / receiver | The IP address of the external server to which the logs will be forwarded |
| *Port | Enter the port number to be used for the server. |
| Enable HTTPS | Enable the HTTPS toggle button if the exposed hostname needs
SSL verification. Refer Configuring Splunk HEC for more details on the configuration steps. |
| Validate Certificate | This field is enabled if you enable the HTTPS toggle
button.
|
| *Upload certificate | Click on Browse to Upload the certificate created from
the HTTP Event Collector URL. Note: Certificate has to be uploaded in the .pem
format. |
| Index | Enter the indexer created while creating the HTTP Event Collector token on Splunk Enterprise for log forwarding on the server. If Indexer is not created and set to default, then it can be left blank. |
| *Authentication Token | Enter the HTTP Event Collector token value generated while creating the HTTP Event Collector token on Splunk Enterprise for log forwarding on the server. |
| * : Mandatory fields | |
Proceed with the integration from step 2 in the section Setting the Integration for Log Forwarding.
MS Sentinel
MMA
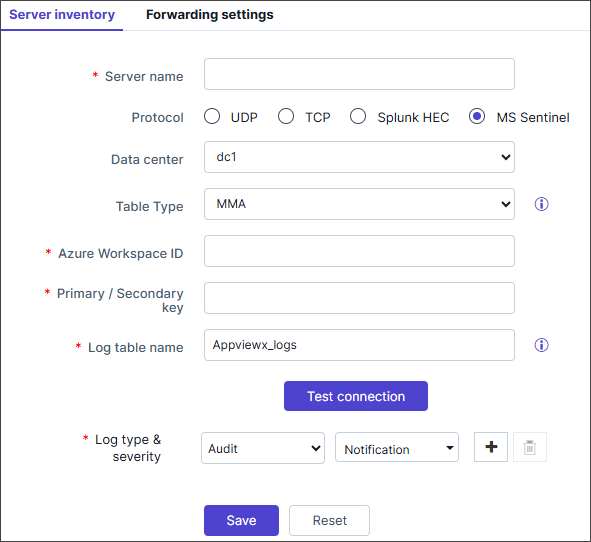
| Field | Description |
|---|---|
| Data center | From the options available in the dropdown, select the data center. |
| Table Type | Select MMA - for legacy Microsoft Monitoring Agent ingestion |
| *Azure Workspace ID | The unique identifier for the Log Analytics
workspace. For more details on steps for Configuring MS Sentinel. For more detailed steps on Creating a resource group during the configuration of MS Sentinel. |
| *Primary / Secondary key | A security key providing access to a range of management and data operations. |
| *Log table name | The default name of the log table is “Appviewx_logs”, which can be changed as per user requirements. The table name will be generated using this specified name within the designated workspace in MS Sentinel for storing logs. |
| * : Mandatory fields | |
Proceed with the integration from step 2 in the section Setting the Integration for Log Forwarding.
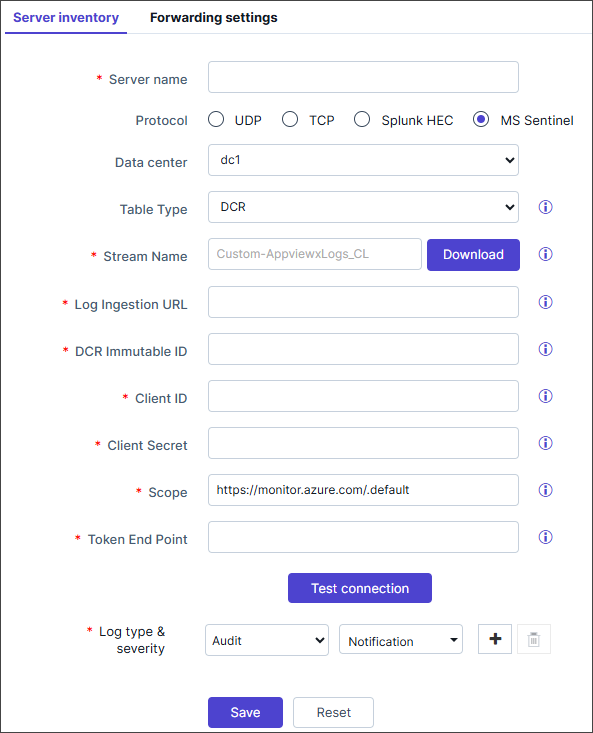
DCR
- On the AppViewX UI
- Click the Download button next to the Stream Name field to download the log files (cefFormatSampleLog.json and syslogFormatSampleLog.json.
- Go to the Forwarding Settings page and set the Log format as required.
- Azure AD Application: Ensure that the application is registered in Azure AD (service account creation) with the necessary API permissions.
- Data Collection Endpoints (DCE): A configured DCE to receive
log data. Refer to the Azure DCE creation steps in Create a data collection
endpoint.
- Once created note the Log Ingestion URL. To obtain the Log Ingestion URL associated with a DCE, navigate to Data Collection Endpoints on the UI. Once you've opened the DCE's overview page, locate the Overview section on the left. The Logs Ingestion will be displayed as part of the DCE's details.
- Log Analytics Workspace: A workspace where logs will be stored and queried. Refer to custom log tables creation steps in the Create a custom table.
- Data Collection Rule (DCR): A DCR with a defined schema and
transformation rules for log ingestion. (A DCR can be created while
creating the custom table above).
- Navigate to the created DCR and from the Overview secion, note the Immutable ID.
- Assign the Monitoring Metrics Publisher role to the created DCR. Navigate to the created DCR and refer to the Role-based access control page for assigning roles.
- Stream Name in DCR: Categorizes logs and routes them to the correct log analytics workspace. It must match a valid stream defined in the DCR. An incorrect stream name may still return HTTP 200 but the logs will not be ingested. Navigate to the created DCR and from the Configuration > Data Sources section, note the Data Source. The data source name is in the format Custom-<name>_CL.
- Navigate to the created DCR and from the Configuration >
Data Sources select the respective Data Source.
Click the three-dot menu and select Edit
Configuration. Upload the sample file (syslog or
cef), once uploaded, click Transformation Editor;
provide suitable filters in the editor to capture logs and
click Save transformation. A sample KQL query filter
is given below.
The logs collected using the filter are shown below:source | extend User = extract(@'\[ User\s*:\s*([^\]]+)\]', 1, event) | extend ObjectDetails = extract(@'\[ ObjectDetails\s*:\s*([^\]]+)\]', 1, event) | extend Devices = extract(@'\[ Devices\s*:\s*([^\]]+)\]', 1, event) | extend SourceIp = extract(@'\[ Source Ip\s*:\s*([^\]]+)\]', 1, event) | extend LoginMethod = extract(@'\[ Login Method\s*:\s*([^\]]+)\]', 1, event) | extend Comments = extract(@'\[ Comments\s*:\s*([^\]]+)\]', 1, event) | extend ActivityTime = extract(@'\[ Activity Time\s*:\s*([^\]]+)\]', 1, event) | extend Message = extract(@'\[ Message\s*:\s*(.*)\s*\]$', 1, event) | project TimeGenerated, User, ObjectDetails, Devices, SourceIp, LoginMethod, Comments, ActivityTime, Message, event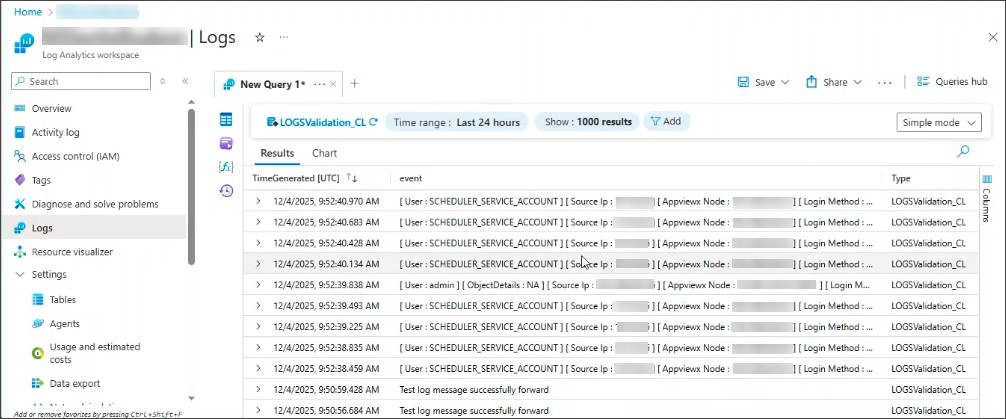
- Register the client app and create a client secret for API
Access: Generate an authorization token based on a client ID
and secret. The token is then passed in the REST API request. Refer
to the app registration steps in Register an App to request
authorization tokens and work with APIs. Note the
Application (client) ID and copy and save the client
secret Value.Note: Client secret values can only be viewed immediately after creation. Be sure to save the secret before leaving the page.
- Endpoint URL for Azure: Navigate to the Home > App Registrations page, click the Endpoints tab and from the Endpoints window, note the OAuth 2.0 token endpoint (v1).
| Field | Description |
|---|---|
| Data center | From the options available in the dropdown, select the data center. |
| Table Type | Select DCR for Data Collection Rule ingestion. |
| *Stream Name | Name of the data stream configured in the DCR, used to route data to the right table. (It is the Data Source name available in the DCR.) |
| *Log Ingestion URL | The endpoint URL of the Data Collection Endpoint (DCE) associated with the DCR. Typically, the logs are sent to this endpoint. Typically it is https://{dce-name}.{region}.ingest.monitor.azure.com. |
| *DCR Immutable ID | Unique identifier of the data collection rule the processes logs. (As created in the DCR in Azure). |
| *Client ID | The client ID of the registered application in Azure AD. (It is the Application (client) ID generated during App Registration in Azure.) |
| *Client Secret | The secret key associated with the registered application. (It is the client secret Value generate during the App Registration in Azure.) |
| *Scope | Specify the scope that defines the permission required for the application to send the logs to MS Sentinel.Typically it is https://monitor.azure.azure.com/default |
| *Token End Point | URL for obtaining the access token. Typically it is https://login.microsoftonline.com/{tenant_id}/oautn2/v.2.0/token. (Is is the OAuth 2.0 token endpoint (v1) noted from the App Registration > Endpoint page.) |
| * : Mandatory fields | |
Proceed with the integration from step 2 in the section Setting the Integration for Log Forwarding.
Enabling Server Inventory Settings
- From the table at the bottom of the Server inventory page, select the server inventory setting you want to enable.
-
From the top right corner of the screen, click
 (Enable) icon.
Note: You can enable multiple server inventory settings by selecting the check box against all the settings you want to enable.
(Enable) icon.
Note: You can enable multiple server inventory settings by selecting the check box against all the settings you want to enable.
Disabling Server Inventory Settings
- From the table at the bottom of the Server inventory page, select the server inventory setting you want to disable.
-
From the top right corner of the screen, click
 (Disable) icon.
Note: You can disable multiple server inventory settings by selecting the check box against all the settings you want to disable.
(Disable) icon.
Note: You can disable multiple server inventory settings by selecting the check box against all the settings you want to disable.
Deleting Server Inventory Settings
- From the table at the bottom of the Server inventory page, select the server inventory setting you want to delete.
-
From the top right corner of the screen, click
(Delete) icon.
Note: You can delete multiple server inventory settings by selecting the check box against all the settings you want to delete.