Managing Logs
Log management is an integral part of any customer-serving application. Monitoring and analyzing user activity logs helps in preventing security breaches, provides an insight into the performance of the applications, and contributes to troubleshooting.
- View logs
- Filter logs
- Forward logs
- Export logs
- Purge logs.
- All
- Audit
- Self Audit
- Certificate
- ADC
- AppViewX
- Syslog
- SSH.
Accessing the Logs
| New Menu | Old Menu |
|---|---|
| In the Platform module, from the navigation pane on
the left, under OBSERVE & EXPLORE, select
Logs. The Logging :: All page is displayed with the All tab open by default. |
From the main navigation menu, select Logging. The Logging :: All page is displayed with the All tab open by default. |
| For more information on how to switch between menus, click here. | |
Viewing Audit Logs
To view the audit logs:
- Go to the Logging :: All page.
-
From the Logging :: All page, from the log categories, click
Audit.
The Logging :: Audit page is displayed. This page displays the following details:
Table 1. Field descriptions for Audit Logs Fields Description Time Date and time at which the activity was carried out User Username of the user who performed the activity. Device name Name of the device, if the log is of a device-related activity Object details Name of the object, if the log is of a object-related activity Source IP IP address of the system that was the source of the activity. AppViewX node IP address of the installed AppViewX node. Method of login The method used for logging in to the AppViewX node, from one of the following: - UI
- AppViewX (used for cronjob-related activities).
Comments Comments related to the activity logged. Log Message Description of the activity logged
- All - Allows the user to view all alerts for the product line, including other users' actions. Recommended for admins or users needing full visibility
- Group - Allows the user to view only alerts from their own user group. Used to restrict visibility to group-specific alerts only.
- Self - Allows the user to view only their own activity alerts for maximum privacy
Viewing Self-Audit Logs
To view the self-audit logs:
- Go to the Logging :: All page.
-
From the Logging :: All page, from the log categories, click Self
Audit.
The Logging :: Self Audit page is displayed. This page displays the following details:
Table 2. Field descriptions for Self-Audit Logs Fields Description Time Date and time at which the activity was carried out User Username of the user who performed the activity. Device name Name of the device, if the log is of a device-related activity Object details Name of the object, if the log is of a object-related activity Source IP IP address of the system that was the source of the activity. AppViewX node IP address of the installed AppViewX node. Method of login The method used for logging in to the AppViewX node, from one of the following: - UI
- AppViewX (used for cronjob-related activities)
Comments Comments related to the activity logged. Log Message Description of the activity logged
Viewing Workflow Logs
To view the workflow logs:
- Go to the Logging :: All page.
-
From the Logging :: All page, from the log categories, click
Workflow.
The Logging page is displayed. This page displays the following details:
Table 3. Field descriptions for Workflow Logs Fields Description Time Date and time at which the activity was carried out. Request ID Workflow Request ID User Username of the user who performed the activity. Work order stage The stage at which an action is performed on the workflow. Alert severity Severity of the workflow. Log Message Description of the activity logged.
Viewing Certificate Logs
To view the certificate logs:
- Go to the Logging :: All page.
-
From the Logging :: All page, from the log categories, click
Certificate.
The Logging :: Certificate page is displayed. This page displays the following details:
Table 4. Field descriptions for Certificate Logs Fields Description Time Date and time at which the activity was carried out User Username of the user who performed the activity. Device name Name of the device, if the log is of a device-related activity. Object details Name of the object, if the log is of a object-related activity. Purpose/Usage Certificate type (server, client, device, code signing) associated with the logged activity. severity Severity of the activity logged (Notification, Debug, Warn, Error, Fatal, Critical). Log Message Description of the activity logged.
Viewing Cloud Logs
To view the cloud logs:
- Go to the Logging :: All page.
-
From the Logging :: All page, from the log categories, click
Cloud.
The Logging :: Cloud page is displayed. This page displays the following details:
Table 5. Field descriptions for Cloud Logs Fields Description Time Timestamp of the event logged User Login name of the user that triggered the event Source IP IP address of the system from which the event was triggered Cloud Account Cloud device name for the event that is being logged Cloud Vendor Cloud device vendor Cloud Service Cloud service associated with the event Note: This field displays the name of the service(s) associated with the event that is being logged. However, there can be instances where events are independent of services. For example, credential validation for the master account is not related to any one service. If an event is independent of services, then all the services associated with the cloud account are listed for ease of searching the logs based on service name.Cloud Region Cloud region associated with the event Note: This field displays the name of the region(s) associated with the event that is being logged. However, there can be instances where events are independent of regions. For example, credential validation for the master account may not be related to any one region. If an event is independent of regions, then all the regions associated with the cloud account are listed for ease of searching the logs based on region name.Event Source Source (AppViewX UI or API) from where the event was triggered Event Type Type of the event being logged Severity Severity of the event triggered This field can have one of the following values:- Critical
- Warning
- Notification
- Debug.
Log Message Details of the event outcome Log Statement Additional details related to the event outcome (optional)
Viewing ADC Logs
To view the ADC logs:
- Go to the Logging :: All page.
-
From the Logging :: All page, from the log categories, click
ADC.
The Logging :: ADC page is displayed. This page displays the following details:
Table 6. Field descriptions for ADC Logs Fields Description Time Date and time at which the activity was carried out User Username of the user who performed the activity Device name Name of the device, if the log is of a device-related activity Object details Name of the object, if the log is of a object-related activity Alert severity Severity of the activity logged (Notification, Debug, Warn, Error, Fatal, Critical) Log Message Description of the activity logged
Viewing AppViewX Logs
To view the AppViewX logs:
- Go to the Logging :: All page.
-
From the Logging :: All page, from the log categories, click
AppViewX.
The Logging :: AppViewX page is displayed. This page displays the following details:
Table 7. Field descriptions for AppViewX Logs Fields Description Time Date and time at which the activity was carried out Device name Name of the device, if the log is of a device-related activity Object details Name of the object, if the log is of a object-related activity Severity Severity of the activity logged (Notification, Debug, Warn, Error, Fatal, Critical) Log Message Description of the activity logged
Viewing Syslog Logs
To view the syslog logs:
- Go to the Logging :: All page.
-
From the Logging :: All page, from the log categories, click
Syslog.
The Logging :: Syslog page is displayed. This page displays the following details:
Table 8. Field descriptions for Syslog Fields Description Time Date and time at which the activity was carried out. Host name Host name of the Syslog server. Log Message Description of the activity logged.
Viewing Firewall Logs
To view the firewall logs:
- Go to the Logging :: All page.
-
From the Logging :: All page, from the log categories, click
Firewall.
The Logging :: Firewall page is displayed. This page displays the following details:
Table 9. Field descriptions for Firewall Logs Category Description Time Date and time at which the activity was carried out. User Username of the user who performed the activity. Device name Name of the device, if the log is of a device-related activity Object details Name of the object, if the log is of a object-related activity Log Message Description of the activity logged.
Viewing Sign Logs
- Go to Logging :: All page.
-
From the Logging :: All page, from the log categories, click
Sign.
The Logging :: Sign page is displayed.
-
Use the following filters to display limited data:
- Search by text field
- Search by time icon (date and time)
- Search by Method of Login dropdown.
This page displays the following details:Table 10. Field descriptions for Sign Logs Fields Description Time Date and time at which the activity was carried out. User Username of the user who performed the activity. Severity Severity of the activity logged (Notification, Debug, Warn, Error, Fatal, Critical). Category Name of the module. In this case - Sign. Method of login Indicates the type of signing. UI is for a file-based signing (File upload and sign) and API is for a hash-based signing. Log message Description of the activity logged. Source IP IP of the device from where the action was performed. AppViewX node IP:node of the AppViewX server from where the action was performed.
Setting the Record Count Preference for Logs
To set the record count preference:
-
On the Logging :: All page, from the top-right corner of the screen,
click
 .
.
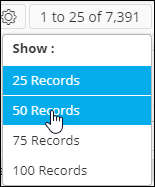
-
From the Show menu displayed, select your record count preference
(for example, 25 records).
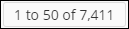
-
The Logging page is updated according to the record count preference
selected. A message, Record count preference saved successfully, is
displayed. The UI control is also updated to display the current selection,
as shown in the following image:
Searching for Logs
AppViewX lets you search for logs in two ways— based on timestamp and the values recorded in each log.
Based on a Timestamp
-
From the Search field on the Logging page, click
 (Clock) icon.
-
Widgets to select the date and time are displayed.
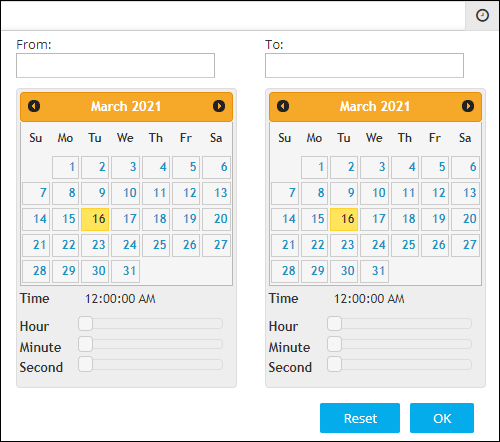
- To select a date range, in the From and To fields, select the required dates.
- To set a time, use the Hour, Minute, and Second slider controls.
-
Click OK.
The page is updated to display log records from the selected timestamp.Note: To view records from a specific date to the current date, select only the From date. When the To field is left blank, by default, it is set to the current date.
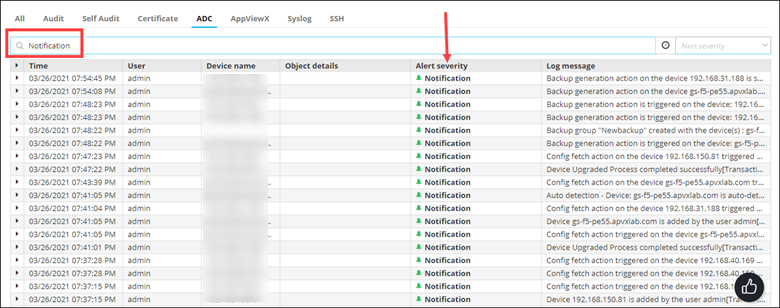
Based on the Values Recorded for each Log
- Go to the Logging :: All page and click the ADC tab.
- From the drop-down menu in the Search field, select a category, for example, Alert Severity, for searching the required logs.
-
In the Search field, enter a search value. for example,
Notification.
The page is updated to display logs that fulfill the search criteria.
Exporting Logs
- Go to the Logging :: All page for the log type you want to export.
-
From the top right corner of the page, click
 (Export) icon.
-
Navigate to the location to save the log file, and click Save.
All logs of the selected log type are downloaded and saved.