
Event Logs
Event Logs is your organization's complete audit trail for AI agent activity every action, access attempt, authentication, and security event, recorded in real time so you can investigate incidents, prove compliance, and spot suspicious patterns.
What are Event Logs
Every time an agent takes an action calls a tool, requests access to a resource, authenticates, or triggers a security rule Agent Identity Security records it here as an event. Each entry captures who or what system was involved, what happened, when it happened, and whether it succeeded or failed.
Think of Event Logs as the security camera footage for your AI agents. When something goes wrong, this is where you look first.
Without Event Logs, your security team cannot:
- Investigate a suspected security incident involving an agent.
- Prove to an auditor that your agents operated within approved boundaries.
- Trace the root cause of an unexpected agent behavior.
- Detect repeated authentication failures that might indicate a compromised credential or misconfigured agent.
- Monitor which agents are generating the most security events.
Summary numbers
Four badges at the top of the page give you an instant health check. Each badge also works as a one-click filter — select it to filter the list to events of that severity. Select it again to clear the filter.
| Badge | What it means |
|---|---|
| Events (total) | Every event ever recorded across all agents and all platforms. This number grows continuously. |
| Critical | Events where something went seriously wrong or a high-severity rule was broken. Select to filter to Critical events only. |
| High | Events flagged as significant but one level below Critical. Select to filter to High events only. |
| Medium | Events that require monitoring but are not immediately urgent. These are the most common event type. |
Event inventory columns
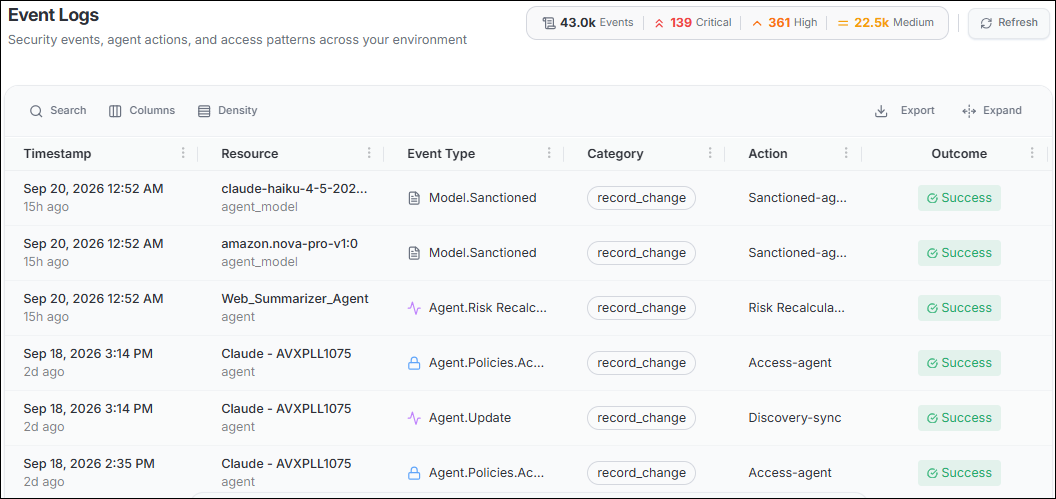
| Column | What it shows |
|---|---|
| Timestamp | The exact date and time the event was recorded, with a relative label such as "3m ago" beneath it. Hover to see the full timestamp. The list defaults to newest events first. |
| Resource | The name of the resource involved — for example, an MCP gateway endpoint, an agent, a credential, or a policy. The resource type appears in smaller text beneath the name. |
| Event Type | A category label for what kind of event this is. Examples include Auth Event, Integration Sync, Gateway Response, and Gateway Dispatch. |
| Category | A higher-level group the event belongs to — for example, mcp_gateway, authentication, or integration_sync. Use these when building filters. |
| Action | The specific action the system or agent attempted — for example, api-key-auth, gateway-to-agent-r..., or server-to-gateway. |
| Outcome | Whether the action succeeded (green Success), failed (red Failed), or is pending. A Failed outcome means the action was rejected or encountered an error. |
Filter and search
With hundreds of thousands of events in a typical production environment, filtering is essential. Agent Identity Security gives you several ways to narrow the list:
- Select a severity badge (Critical, High, or Medium) at the top to filter by risk level.
- Select the filter icon next to any column header for a column-specific filter for example, filter Outcome to "Failed" to see only events that did not succeed.
- Select Search and type a keyword such as an agent name, resource name, or action.
- Apply multiple filters at the same time. Active filters appear as badge chips below the toolbar. Select x on a chip to remove it, or select Clear all to start fresh.
Export event logs
Select Export in the grid toolbar to download event data. Agent Identity Security supports four export formats:
| Format | Best for |
|---|---|
| JSON | Feeding event data into automated tools, scripts, or data analysis workflows. |
| CSV | Opening in Microsoft Excel or Google Sheets for manual review or reporting. |
| CEF | Sending to SIEM tools such as Splunk, ArcSight, or IBM QRadar. |
| LEEF | Direct ingestion into IBM QRadar. |
Read a single log entry
Select any row in the event list to open the full Event Log detail page. This page shows everything Agent Identity Security captured about that one event, organized across four tabs:
| Tab | What you find there |
|---|---|
| Event Story | A plain-language summary of what happened the action attempted, the outcome, and a message explaining the result in non-technical terms. The first tab you see when you open any log entry. |
| Context | The entities connected to the event, each shown as a card the resource, the agent (if identified), and metadata tags such as event type, authentication method, and endpoint ID. |
| Details and Changes | The raw technical data captured at the time of the event. When an event records a change for example, a policy edit this tab also shows Before (red) and After (green) panels. |
| Raw JSON | The complete log record exactly as stored in Agent Identity Security, formatted as readable JSON. Use for compliance evidence, debugging, or feeding data into external tools. Select Copy or Download to save. |
Respond to a Critical authentication failure
When you find a Critical Failed authentication event at an MCP Gateway endpoint, follow these steps:
- Copy the endpoint ID from the Context tab.
- Navigate to Secure > MCP Gateway and search for the endpoint using the copied ID. Verify it is still active and check whether its credential configuration is correct.
- If the endpoint should be receiving API key requests, confirm the calling application is sending the Bearer token correctly. The USER_AGENT field in the Details tab identifies which application made the call.
- Check Event Logs for the same resource over the past 24 hours. Repeated Critical failures from the same IP address may indicate a misconfigured integration or a suspicious external caller.
- If the failures are unexpected and no legitimate application should be calling this endpoint, navigate to Secure > MCP Gateway and deactivate or delete the endpoint to stop traffic.
- Document your findings by downloading the Raw JSON and attaching it to your incident management or ticketing system.
Common difficulties
| Difficulty | What to do |
|---|---|
| The event list shows hundreds of thousands of events and is hard to navigate. | Apply filters before browsing. Start by selecting the Critical badge to see only the most urgent events. Then use the column filter on Event Type or Category to narrow further. |
| I cannot find the event I am looking for. | Use the Search bar to type a keyword. If the event happened more than a few hours ago, use the Timestamp column filter to set a date range before searching. |
| The export only downloads 1,000 records but I need more. | Apply a narrower filter (for example, filter by Category = mcp_gateway and a specific date range) before exporting. Each export is capped at 1,000 records per request. |
| The Context tab shows "Unknown" for the resource. | The gateway could not match the request to a registered resource. This happens when the endpoint was deleted after the event was recorded, or when the request arrived before the endpoint was fully registered. |
| The actor shows "System" or null in the Context tab. | The event was triggered by an automated process, not a human user. This is normal for authentication events, integration sync events, and scheduled workflow runs. |
| I need to share this log with an external auditor. | Use the Raw JSON tab and select Download to save the complete log record as activity-log.json. This file contains all fields and is suitable for compliance evidence. |
