Designing a Chart with Static Data 
- Design a workflow.
- From the User Interface section, drag and drop the Chart task.
-
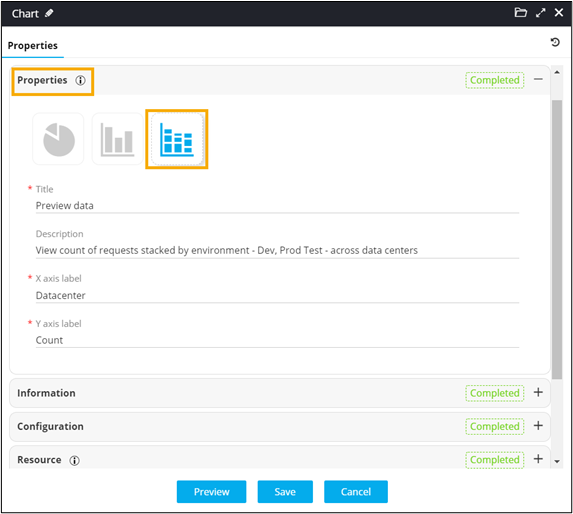
In the Chart task window, under
Properties, select the chart type as stacked chart
 .
.
-
In the Chart task window, under
Properties, enter values for chart Title
and X-axis, Y-axis labels.
-
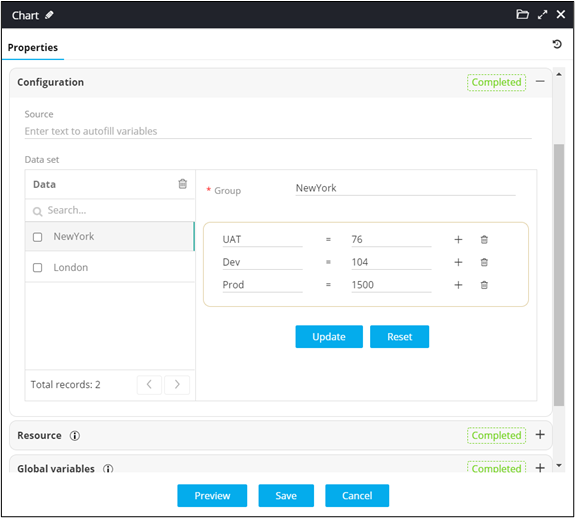
In the Chart task window, under
Configuration, define the static data to stack values
in the chart.
-
In the Chart task window, under
Resource, define the permissions in the chart as
follows:
- V (View) - Users can only view the interface. There is no Submit or Cancel buttons provided.
- R (Review) - Users can only view/read, Submit and Cancel without editing the task.
- RW (Read Write) - Users can read/write, Edit, Submit, and Cancel the task.
- Click Save.
- Connect the workflow tasks.
-
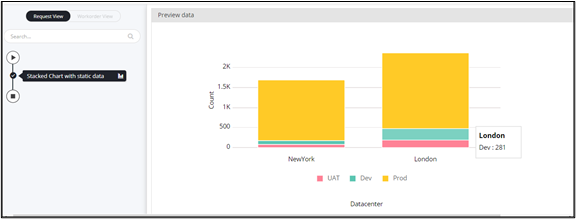
From the command bar on the top, click Preview.
Stacked chart with static data is displayed.