Designing a Chart with Dynamic Values 
- Design a workflow.
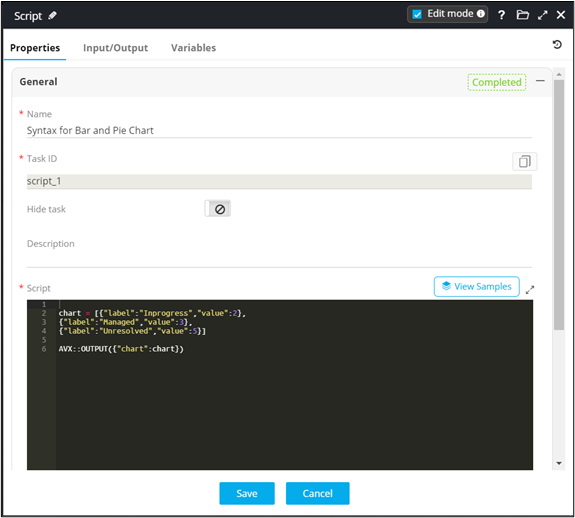
- From the General section, drag and drop a Script task.
-
In the Script task window, under Properties, define a
Script to get a list of values for the chart.
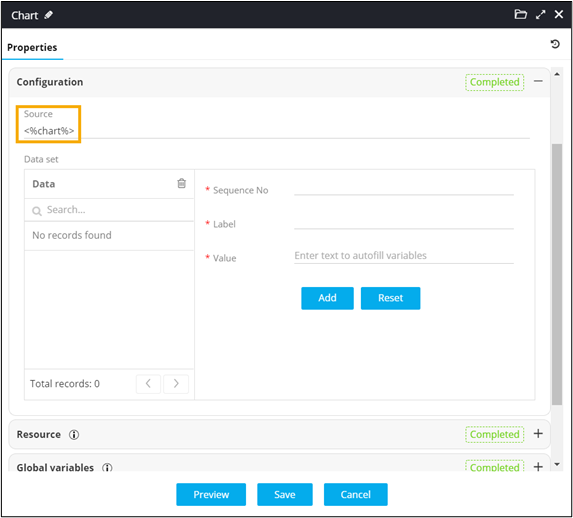
- From the User Interface section, drag and drop a Chart task.
-
In the Chart task window, under Properties, select the chart type
as Pie
 and enter or select the field information.
- Enter the chart Title (mandatory field) and Description and select the Legend position.
-
Under Configuration, refer the global variable to render data.
-
Connect the workflow tasks
and from the menu on the top, click Preview.
Chart with dynamic values is displayed.
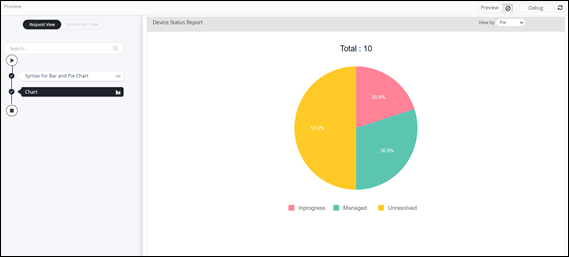 Note: You can view this chart as a Donut chart by selecting the option from the View by dropdown.