Quantum Trust Hub: Code Scan
A PQC-focused code scan assesses source code to detect the presence of quantum vulnerable cryptography embedded in code.
While certificates are as vulnerable to quantum attacks, they are easier to replace once their quantum-readiness has been assessed due to expiry. Code, however, lasts years, especially for embedded systems, financial applications, IoT, and firmware. Without code scanning, organizations risk leaving quantum vulnerable crypto buried in applications long after TLS certificates have been upgraded.
- Cryptographic methods
- Crypto libraries
- Crypto algorithms used in source code
Prerequisite: Verify that your user role has the required ACF permission to view code scan reports. To enable ACF permission, click here.
The Code Scan dashboard offers a consolidated view of your organization’s software code security posture, highlighting which parts of your codebase are quantum vulnerable.
To view the Code Scan dashboard, go to .
The dashboard widgets are explained in the subsequent sections.
Quantum Readiness Overview
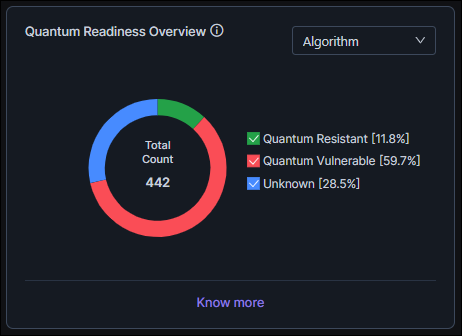
Quantum vulnerable: Code that is embedded with classical public-key algorithms that are at risk in a post-quantum environment
Quantum resistant: Code that is embedded with post-quantum or hybrid implementations designed to withstand classical as well as quantum computational attacks
Additionally, a code scan may return unknown findings for crypto assets that can be scanned only in runtime.
- Direct cryptographic usage: Cryptographic algorithms and operations that are implemented or invoked directly in the application code
- Library-based cryptographic usage: Cryptographic functionality provided indirectly through third-party libraries, SDKs, or frameworks that internally use cryptographic algorithms
As seen in the image, the chart is rendered using three segments, Quantum Resistant, Quantum Vulnerable, and Unknown (Runtime-Resolved) each representing the percentage distribution of the quantum exposure findings.
The chart is rendered with the following interactivities:
- Use the filter in the top-right corner of the chart to view the quantum readiness according to the following usage patterns: direct cryptographic usage (Algorithm) and library-based cryptographic usage (Library)
- Hover over each segment to see the percentage distribution (also displayed in the chart legend).
- Click a legend to show/hide the corresponding category on the chart.
- Click Know More for a detailed reading and the recommended next steps.
Code Scan Count Cards
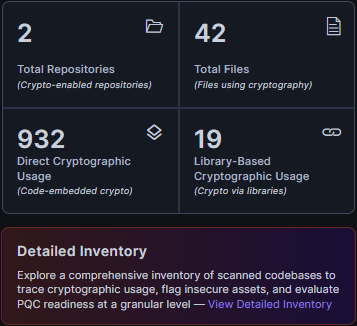
- Total Repositories Scanned: Total number of source code
repositories scanned for PQC-readiness.
A repository here refers to containers for source code, for example, GitHub, GitLab.
- Total Files Scanned: Total number of scanned files with crypto components
- Total Cryptographic Usage: Total number of instances of
direct usage of cryptographic functions in the source code scanned across
repositories.
This count card is interactive; to view details of these instances, click the count card and you will be redirected to the Direct Cryptographic Usage tab in the Code Scan inventory.
- Total Cryptographic Dependencies: Total number of
cryptographic dependencies detected in the source code scanned across
repositories.
A cryptographic dependency refers to external libraries, modules, or packages that the source code relies on for performing cryptographic operations like encryption, decryption, key generation, and so on.
The code scan checks these external cryptographic dependencies to determine how they impact the quantum-readiness of your application code.
This count card is interactive; to view details of these instances, click the count card and you will be redirected to the Cryptographic Dependencies tab in the Code Scan inventory.
Quantum Readiness Posture
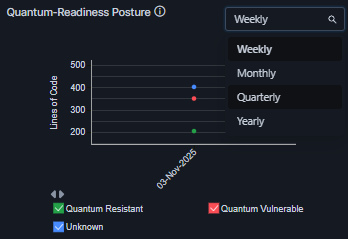
Based on the results of the PQC-focused source code scan, the Quantum Readiness Posture chart indicates the PQC-readiness of your codebase for resisting potential quantum threats.
The chart plots the number of crypto assets scanned for a selected duration, and represents the code that is quantum safe (with a green line) and quantum vulnerable (with a red line), as well as code whose quantum safety status could not be determined (with a blue line).
You can select the duration to be plotted on the Y-axis from the dropdown list in the top-right corner of the widget. The chart legends are interactive. Select/clear the checkbox for a quantum safety status value to show/hide, respectively, the corresponding data on the chart.
Cryptographic Library Sources
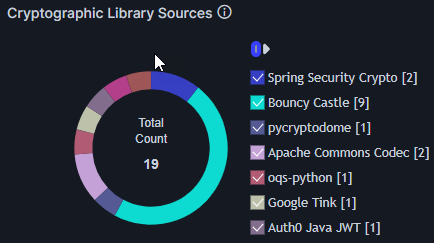
The Cryptographic Library Sources donut chart shows the distribution of external cryptographic libraries usage across repositories. The chart plots the data that is displayed in the Cryptographic Dependencies tab in the Code Scan inventory.
To view the data specific to a cryptographic library, click the corresponding donut slice. You will be redirected to the Cryptographic Dependencies tab in the Code Scan inventory filtered for the selected library.
The legend lists the cryptographic libraries detected and the usage count for each. Use the interactive legend to filter the visualization for specific libraries.
Quantum Readiness by Crypto Library
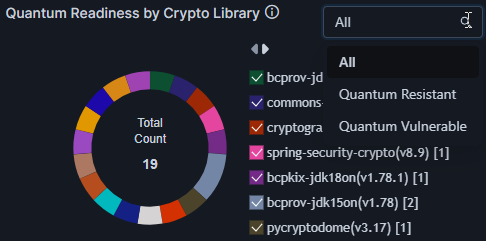
The Quantum Readiness by Crypto Library chart shows the quantum readiness of each cryptographic library in your environment.
Use the dropdown list in the top-right corner of the chart to filter the chart data, showing only quantum resistant libraries, quantum vulnerable libraries, or both.
The chart elements are interactive. To view the repositories associated with each cryptographic library, click the corresponding donut slice. You will be redirected to the Cryptographic Dependencies tab in the Code Scan inventory filtered for the selected library.
The chart legends are also interactive. Select/clear the checkbox for a cryptographic library to show/hide, respectively, the corresponding data on the chart.
Quantum Readiness by Repository
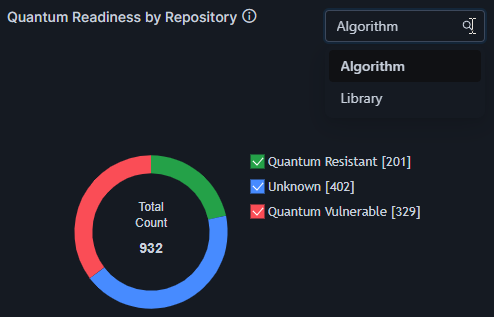
The Quantum Readiness by Repository donut chart shows the distribution of quantum vulnerable and quantum resistant algorithms and libraries in your environment. Use the dropdown list to filter the chart data for algorithms and libraries, as required.
The chart elements are interactive. To view the data for a quantum safety status, click the corresponding donut slice. For repository type Algorithm, you will be redirected to the Direct Cryptographic Usage tab in the Code Scan inventory, filtered for the selected quantum safety status. For repository type Library, you will be redirected to the Cryptographic Dependencies tab in the Code Scan inventory filtered for the selected quantum safety status.
The chart legends are also interactive. Select/clear the checkbox for a quantum safety status value to show/hide, respectively, the corresponding data on the chart.
Quantum Readiness by Language
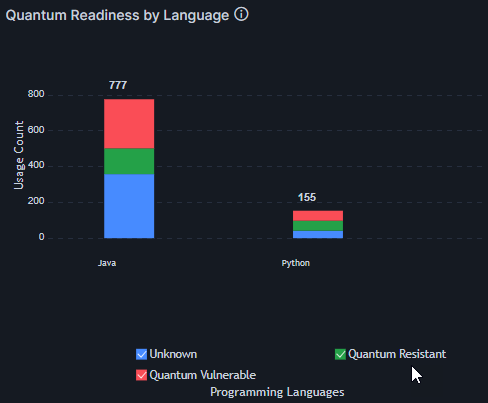
The Quantum Readiness by Language stacked bar chart shows quantum safety status according to the programming languages used in your codebase.
The chart elements are interactive. To view the data for the programming languages that correspond to a quantum safety status, click the associated bar in the chart. You will be redirected to the Direct Cryptographic Usage tab in the Code Scan inventory filtered for the selected quantum safety status.
The chart legends are also interactive. Select/clear the checkbox for a quantum safety status value to show/hide, respectively, the corresponding data on the chart.
Algorithm Usage Summary
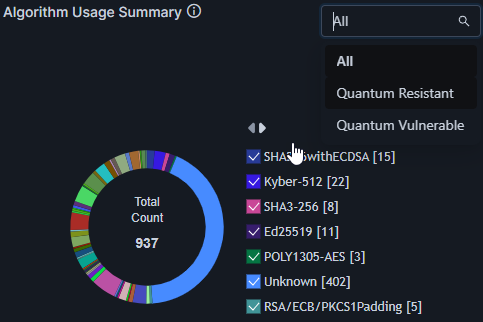
The Algorithm Usage Summary donut chart shows a snapshot of the different algorithms used in your codebase.
Use the dropdown list in the top-right corner of the chart to filter the data, showing only quantum resistant algorithms, quantum vulnerable algorithms, or both.
The chart elements are interactive. To view the data for an algorithm, click the associated slice in the donut chart. You will be redirected to the Direct Cryptographic Usage tab in the Code Scan inventory filtered for your selection.
The chart legends are also interactive. Select/clear the checkbox for an algorithm to show/hide, respectively, the corresponding data on the chart.
Quantum Readiness by Algorithm Type
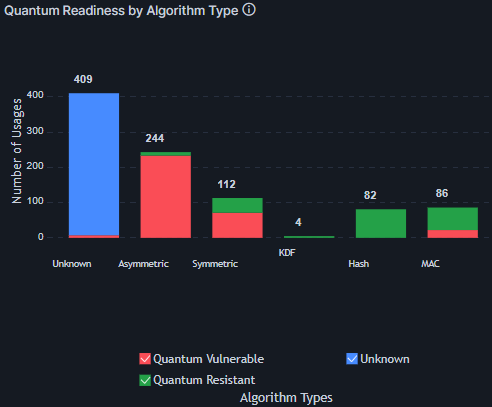
The Quantum Readiness by Algorithm Type column chart shows quantum safety status according to the different algorithm types used in your codebase.
The chart elements are interactive. To view the data for algorithms that correspond to a quantum safety status, click the associated bar in the chart. You will be redirected to the Direct Cryptographic Usage tab in the Code Scan inventory filtered for the selected quantum safety status.
The chart legends are also interactive. Select/clear the checkbox for a quantum safety status value to show/hide, respectively, the corresponding data on the chart.