View Timeline Statistics for an Object
To view a customizable graph that displays timeline statistics for an F5, Citrix or A10 object visible through the App Search module:
-
Go to Menu >
ADC+ > TRAFFIC MANAGEMENT >
App Search.
The Control Center search screen appears.
- Run a search.
-
By default, the search results are displayed in the
 (Application
view) page. Right-click the device name and select View >
View graph from the dropdown list that appears.
(Application
view) page. Right-click the device name and select View >
View graph from the dropdown list that appears.
-
If you want to view the statistics for the search results displayed
on the infrastructure view, click the
 (Infrastructure view) button to switch from
the Application view search result page.
(Infrastructure view) button to switch from
the Application view search result page.
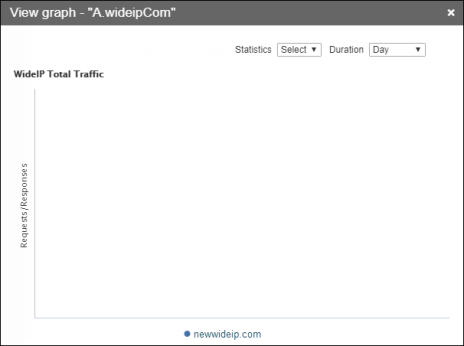
- Select the checkboxes beside the first column of each object details and then,
navigate to Actions > View > View graph. A statistics
chart appears, displaying the following two fields at the top:
-
Statistics - The entries in this list vary depending on the device you selected. As you select different entries, the graph below updates to display the statistics related to the item you chose.
-
Interval - The following time intervals can be selected: Day, Week, Month, or 3 Months. As you select different intervals, the graph below updates to display the statistics for the corresponding time frame.
-