Managing Logs
To access the logs related to KUBE+, go to > > > and then click the Kube tab, if not selected by default.
On the Logging page,
- go to the pages, click the
 (navigation) icon.
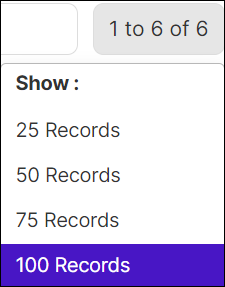
 - hover the mouse over the number of row displayed on the page, the Show popup
opens and choose the no. of rows to be displayed on the page.
Viewing Details of a Log
To view log details:
- Go to Menu > KUBE+ > LOGS > Logs.
- On the Logging page, click the Kube tab.
-
On the log screen, view all details for a log by hovering your cursor over
each column of data or click the
 (Expand) icon for the log you want to view. The table row expands
to display all details for the log.
Note: Search for any logs from the logging list based on User, Device name, log message, object details, source IP, AppViewX node, Method of login also search based on a particular column.
(Expand) icon for the log you want to view. The table row expands
to display all details for the log.
Note: Search for any logs from the logging list based on User, Device name, log message, object details, source IP, AppViewX node, Method of login also search based on a particular column.
Filtering Logs
- Go to Menu > KUBE+ > LOGS > Logs.
- Click the Kube tab.
-
On the Logging page, follow any of the following method to filter the
logs:
- Click
 (DateTime) icon, select the date range,
and the click OK to view the logs within the
date range.
(DateTime) icon, select the date range,
and the click OK to view the logs within the
date range. - Click the dropdown option beside the DateTime icon, and then select
the preferred option. The options are:
- Service
- User
- Type
- Log Message
- Severity
- Click