DNS Zone Traffic Reports
In this dashboard users can get insights into the DNS landscape, traffic information, and
across multiple DNS Vendors.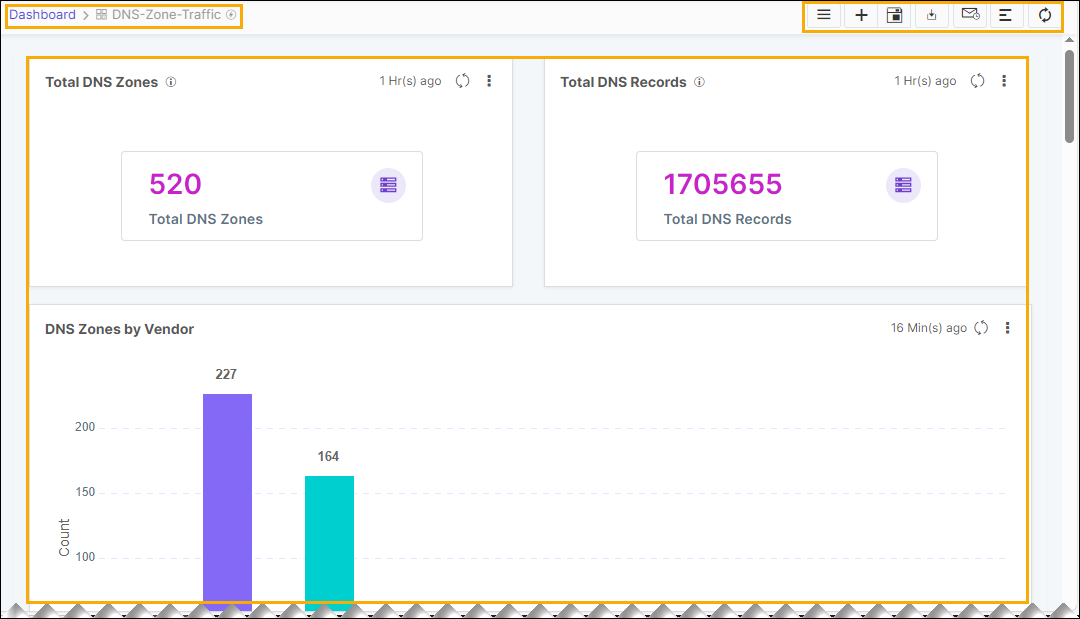
The following reports are available under the DNS Zone Traffic tab:
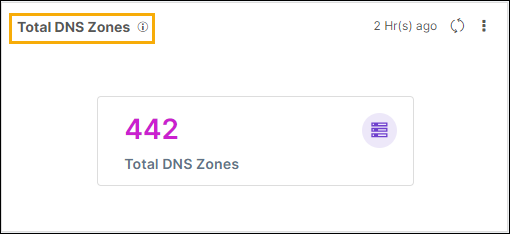
- Total DNS Zones: This metric displays the total number of DNS zones
managed in the inventory across DNS vendors.
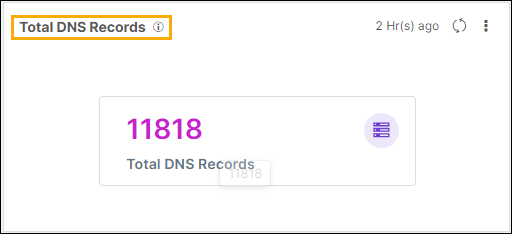
- Total DNS Records: This metric displays the total number of DNS records
managed in the inventory across DNS vendors.
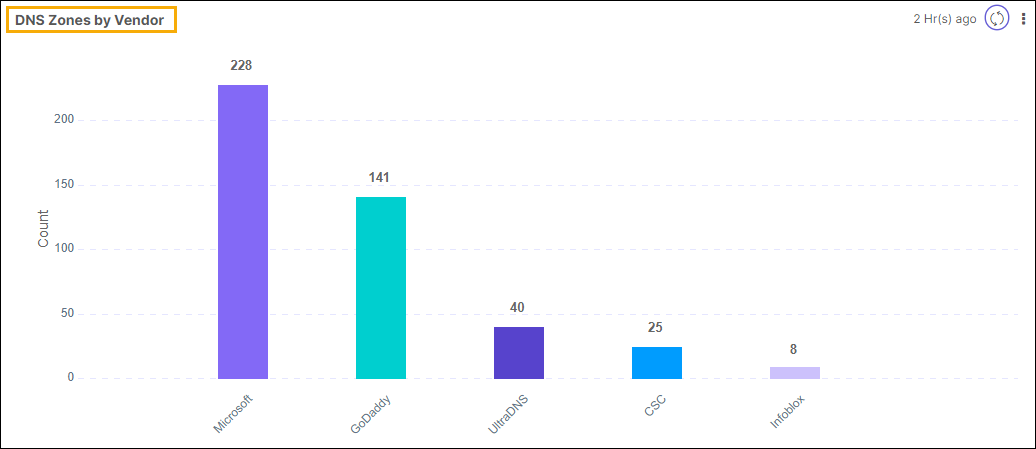
- DNS Zones by Vendor: This report displays the number of zones registered
by vendor. The X-axis represents the names of the vendors and Y-axis represents
the number zones per vendor.
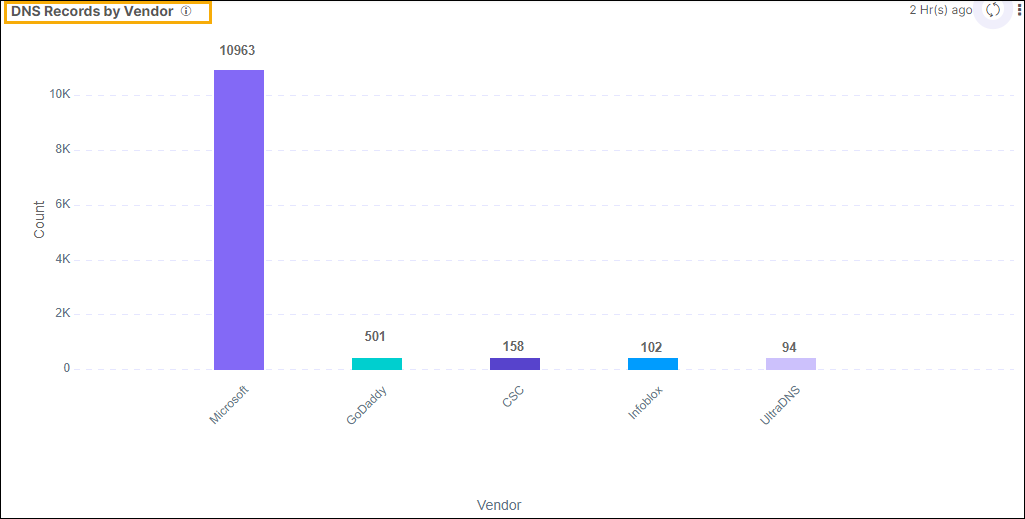
- DNS Records by Vendor: This report displays the total number of DNS
Records managed across DNS vendors configured in the integration hub. The X-axis
displays the names of the vendors and Y-axis represents the number of DNS
records.
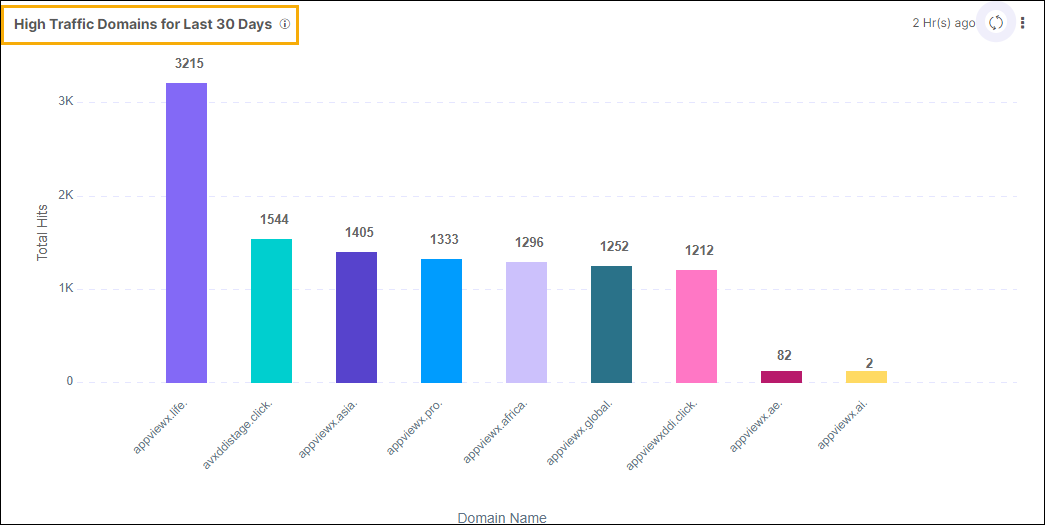
- High Traffic Domains for Last 30 Days: This graph displays information
about the domains that received high traffic in the last 30 days. The X-axis
represents the domain names and Y-axis represents the number of hits to the
domain (in thousands).
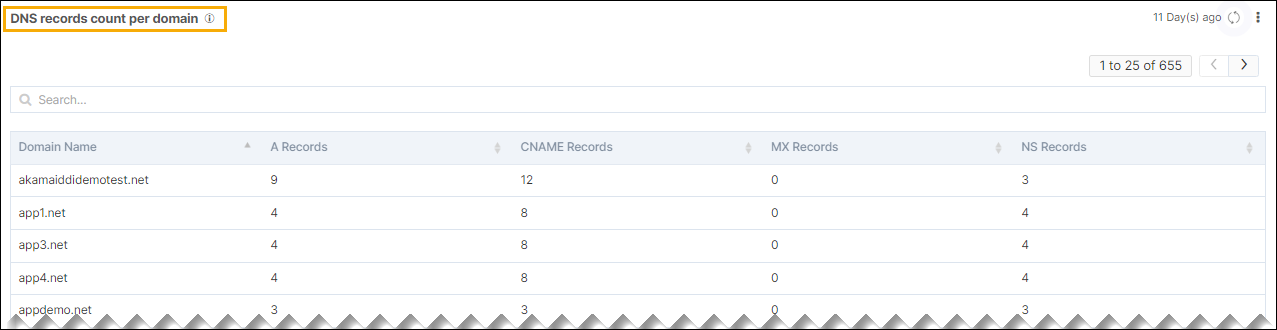
- DNS records count per domain: This grid displays information about the
number of DNS records for each domain. Only 25 records are displayed at a time.
You can use the pagination arrows to view more records. Type the domain name in
the search bar for DNS records information for that domain.
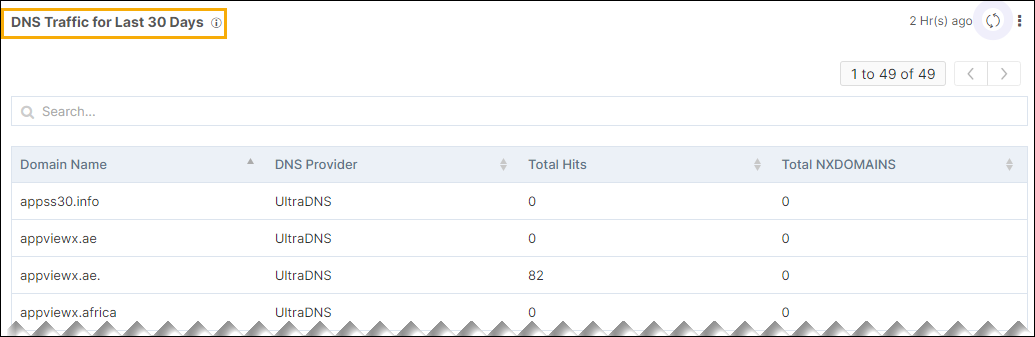
- DNS Traffic for Last 30 Days: This grid displays information on the
traffic hits on all domains in the last 30 days. Only 25 records are displayed
at a time. You can use the pagination arrows to view more records. Type the
domain in the search bar for expiry information about a specific domain.
Note: You can click on the corresponding metric to view the detailed
information.