About Dashboard
The dashboard allows you to manage, monitor, and interpret all the configured devices. It provides customizable widgets to get an overview of all the firewall devices, manager, and device under managers, firewall rules, firewall vendors, and configuration within the AppViewX platform. Customize your application dashboard with predefined and custom widgets as per the business requirements. You can create, save, download, e-mail, and align the dashboards.
- Insights - Firewall Summary (Default)
- Firewall.
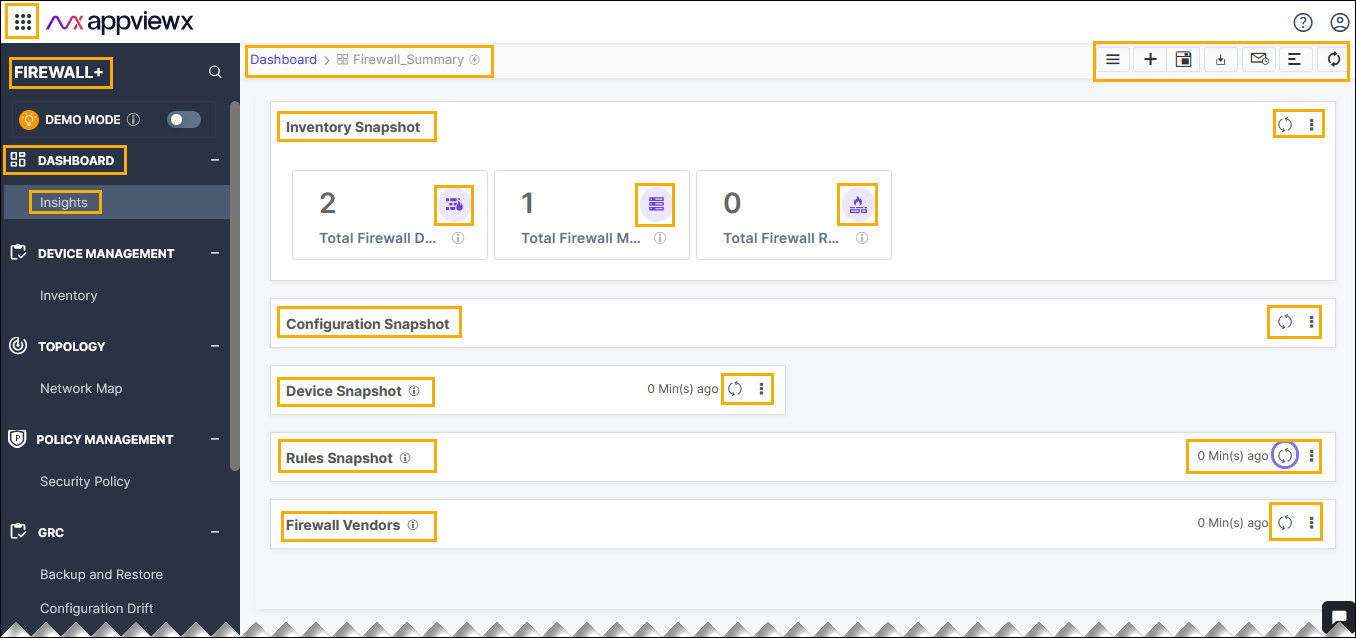
Insights - Firewall Summary Dashboard
The INSIGHTS menu provides comprehensive information and analysis regarding the overall device/object/application summary, compliance, and security of applications/devices delivered through the AppViewX infrastructure. The INSIGHTS menu populates with relevant data, once the devices have been successfully on-boarded and the applications are discovered.
The firewall summary dashboard manages and presents information about the firewall inventory, firewall rules, firewall vendors, and configurations within the AppViewX platform.
-
Go to Menu > FIREWALL+ > INSIGHTS.
The Firewall_Summary page is displayed.
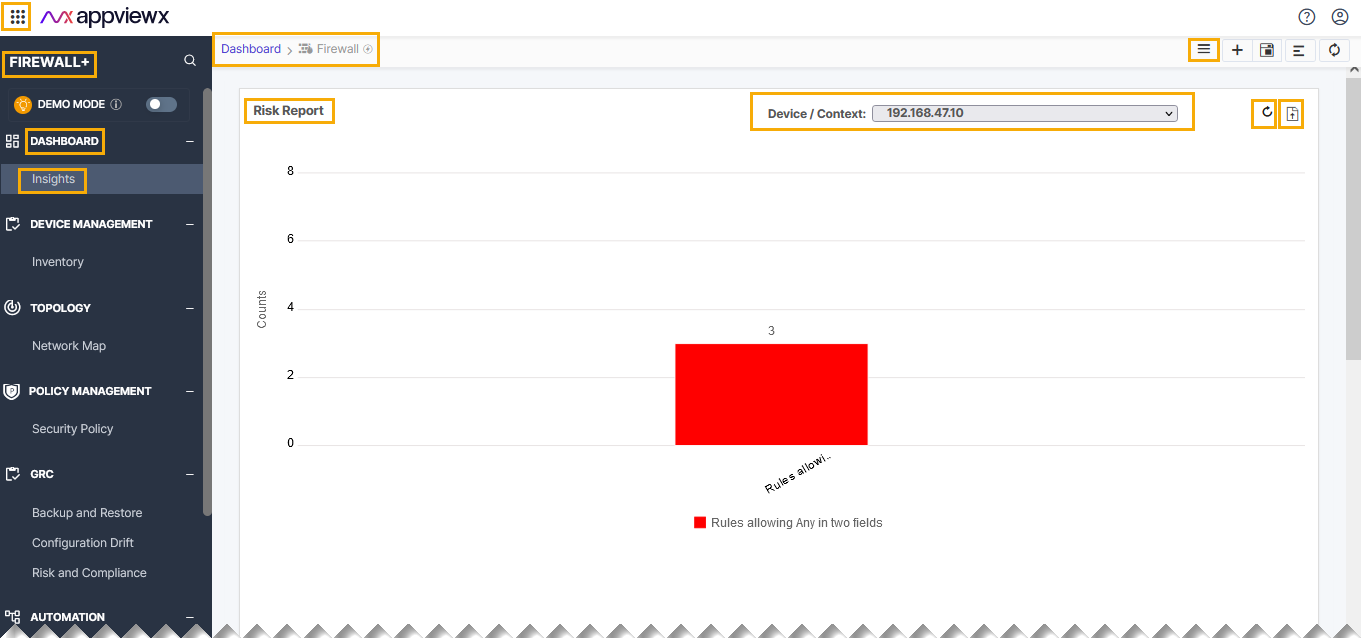
Firewall Dashboard
The firewall dashboard manages and displays the Optimization report supported by product for security rules and NAT rules, Firewall rule compliance report, and Risk report of the AppViewX platform.
-
Go to Menu > FIREWALL+ > INSIGHTS
-
Click the
 (Dashboard
Inventory) icon, and then select Firewall from the
list.
(Dashboard
Inventory) icon, and then select Firewall from the
list.The Firewall dashboard page is displayed.