About Dashboard
Before you begin
- To configure dashboards and widgets, the user should have ACF permissions.
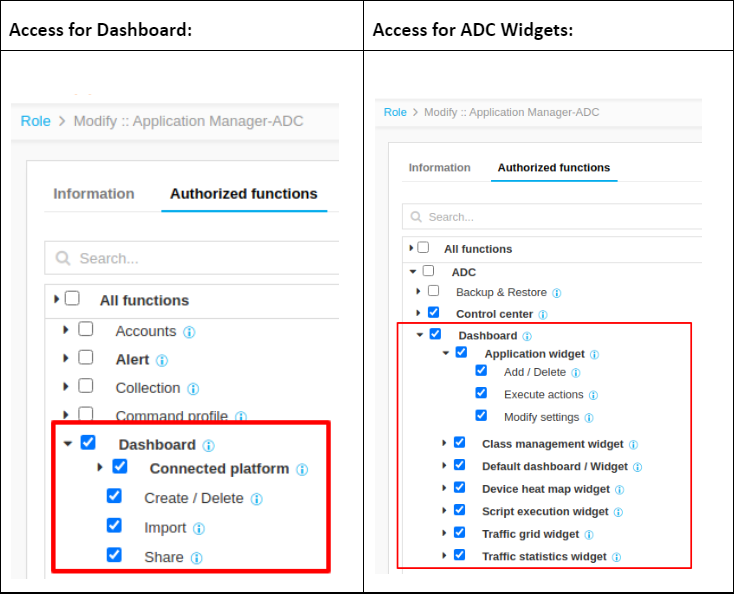
- For adding objects in the widgets, the device should be Managed in the inventory and the user should have object level access (ACL) in the resources. For performing actions on the object, RW permission should be provided.
Default Dashboard
The Default ADC Dashboard is pre-configured and has a default set of widgets. The widgets are Device heat map, Top 10 VIPS by Connection, Application Heatmap, Number of Objects, Top 25 Applications by Connection and Unused Objects Report.
To view the reports related to ADC,
-
Go to Menu > ADC+ > TRAFFIC MANAGEMENT > Dashboards.
A pre-built ADC Dashboard appears by default.
-
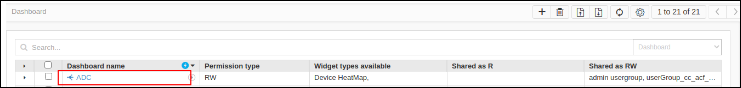
From Dashboard Inventory click on ADC dashboard.
Note: The default widgets can be viewed, aligned, and/or
refreshed and not editable.
Widgets in Default Dashboard
-
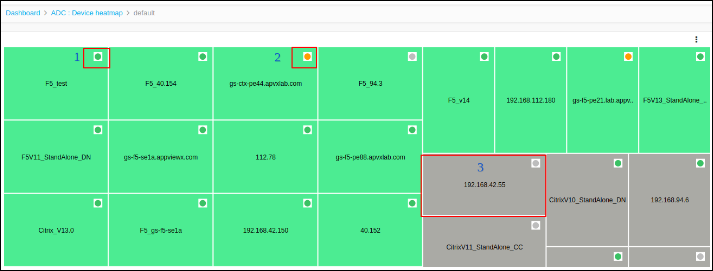
Device heat map
Device heat map widget shows the CPU utilization, Bandwidth Utilization and Memory Utilization of each device managed in Device Inventory.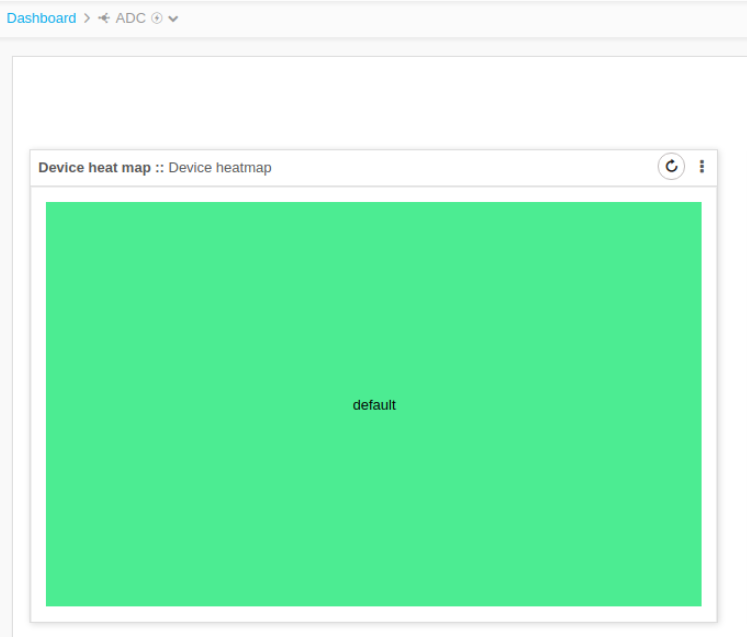
-
Active Device
-
Standby Device
-
Unreachable devices are shown as Grey.
-
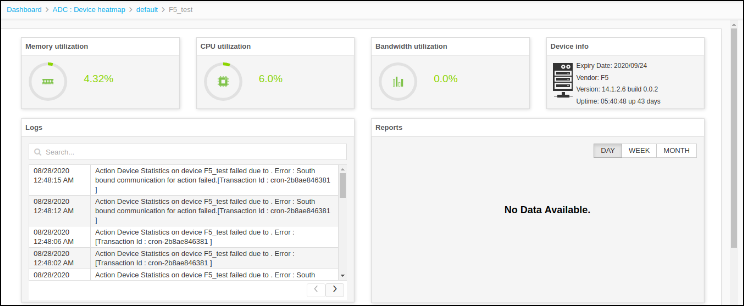
Click on the Device and to get detailed information about CPU utilization.
Unused Object Report
Unused Object Report shows the number of unused objects over a period of
time. Supported vendors are F5, A10, and Citrix.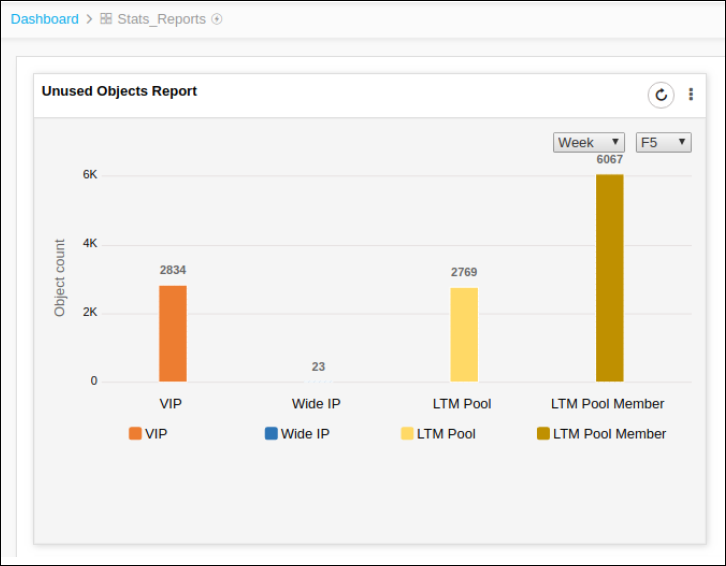
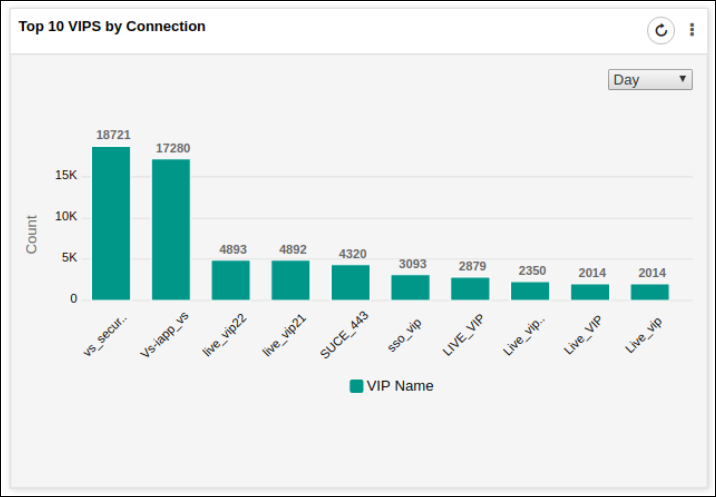
Top 10 VIPS by Connection
This widget shows the details about the top 10 VIPs.